Digital Realty Trust Inc
Digital Realty Trust, Inc. (NYSE: DLR) is a real estate investment trust. The Company owns, acquires, develops, and operates data centers through its operating partnership subsidiary, Digital Realty Trust, L.P. The Company is focused on providing data center, collocation, and interconnection solutions for domestic and international customers across a variety of industry verticals ranging from cloud and information technology services, communications and social networking to financial services, manufacturing, energy, healthcare, and consumer products.
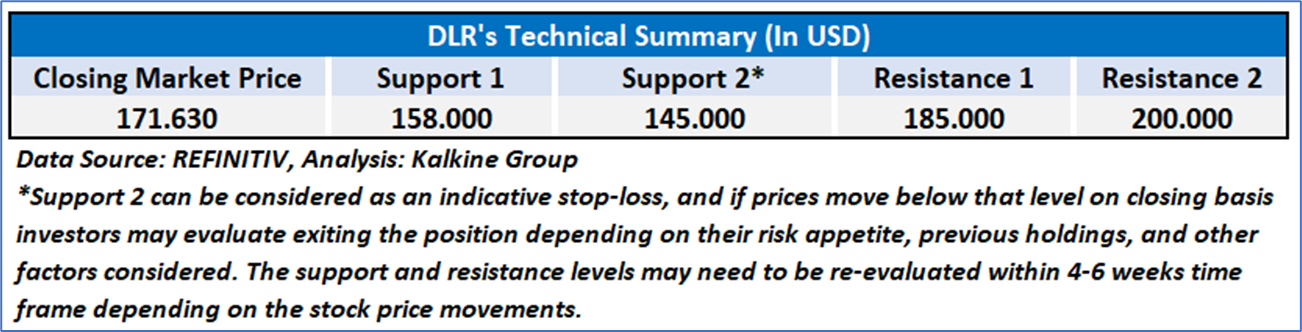
As per our previous US Dividend Income Report published on ‘DLR’ on October 22, 2025, we provided a ‘Buy’ stance on the stock at USD 171.63 based on “Digital Realty Trust, Inc.’s (NYSE: DLR) robust FY2025 trajectory—highlighted by a 58% YoY revenue increase, a record USD 826 million backlog, 13% EBITDA growth, and improved 7.3% renewal spreads—the company’s raised core FFO guidance of USD 7.15–7.25 per share reinforces its strong growth outlook, expanding recurring revenues, disciplined capital deployment, and resilient occupancy trends” and the stock price has now moved up by ~8.16% since then and has attained resistance 1 and moving towards resistance 2.
Noted below are the details of support and resistance levels provided in our previous report:
Rationales For “Sell” at Current Levels:
- Earnings Compression Despite Revenue Growth: While Digital Realty continues to demonstrate robust top-line expansion, with revenues increasing 14% year-over-year to USD 1.6 billion in Q4 2025, profitability metrics present a more tempered picture. Notably, net income per share declined materially to USD 0.24 from USD 0.51 in the prior year period . This divergence between revenue growth and bottom-line compression indicates rising cost pressures, non-operating impacts, or capital structure effects, suggesting that incremental revenue is not translating proportionately into shareholder earnings.
- High Capital Intensity and Elevated Investment Requirements: Digital Realty’s business model remains inherently capital-intensive, as reflected in its projected development CapEx of USD 3.25–3.75 billion for 2026 . While such investments support long-term capacity expansion and AI-driven demand, they also necessitate continuous funding through debt, equity issuance, or asset recycling. This ongoing capital requirement can dilute returns, constrain free cash flow generation, and increase dependence on external financing, particularly in a higher interest rate environment.
- Leverage Profile and Financing Sensitivity: The company maintains a substantial debt load, with total debt of approximately USD 18.4 billion and a net debt-to-Adjusted EBITDA ratio of 4.9x . Although manageable within REIT norms, this leverage level introduces sensitivity to financing costs and capital market conditions. Additionally, recent debt issuances and refinancing activities highlight continued reliance on external capital, which may exert pressure on future earnings if borrowing costs remain elevated or liquidity conditions tighten.
- Execution Risk Embedded in Development Backlog and Leasing Lag: Digital Realty reported a significant backlog of USD 817 million in annualized GAAP base rent; however, the weighted-average lag between lease signing and commencement stands at approximately eight months . This delay introduces execution risk, as revenue realization is deferred and contingent upon project completion timelines and customer onboarding. Furthermore, any construction delays, cost overruns, or shifts in demand could impact the conversion of backlog into actual cash flows.
- Moderate Organic Growth and Margin Sensitivity: Despite positive leasing trends and rental rate increases, the company’s forward outlook indicates relatively moderate same-capital cash NOI growth of 4.0%–5.0% for 2026 . This suggests that a significant portion of growth remains dependent on external development rather than purely organic expansion. Additionally, Adjusted EBITDA declined sequentially by 1% in Q4 2025, indicating some margin pressure in the near term. As a result, sustaining high valuation multiples may require continued execution excellence amid a structurally capital-heavy and competitive environment.
Daily Chart
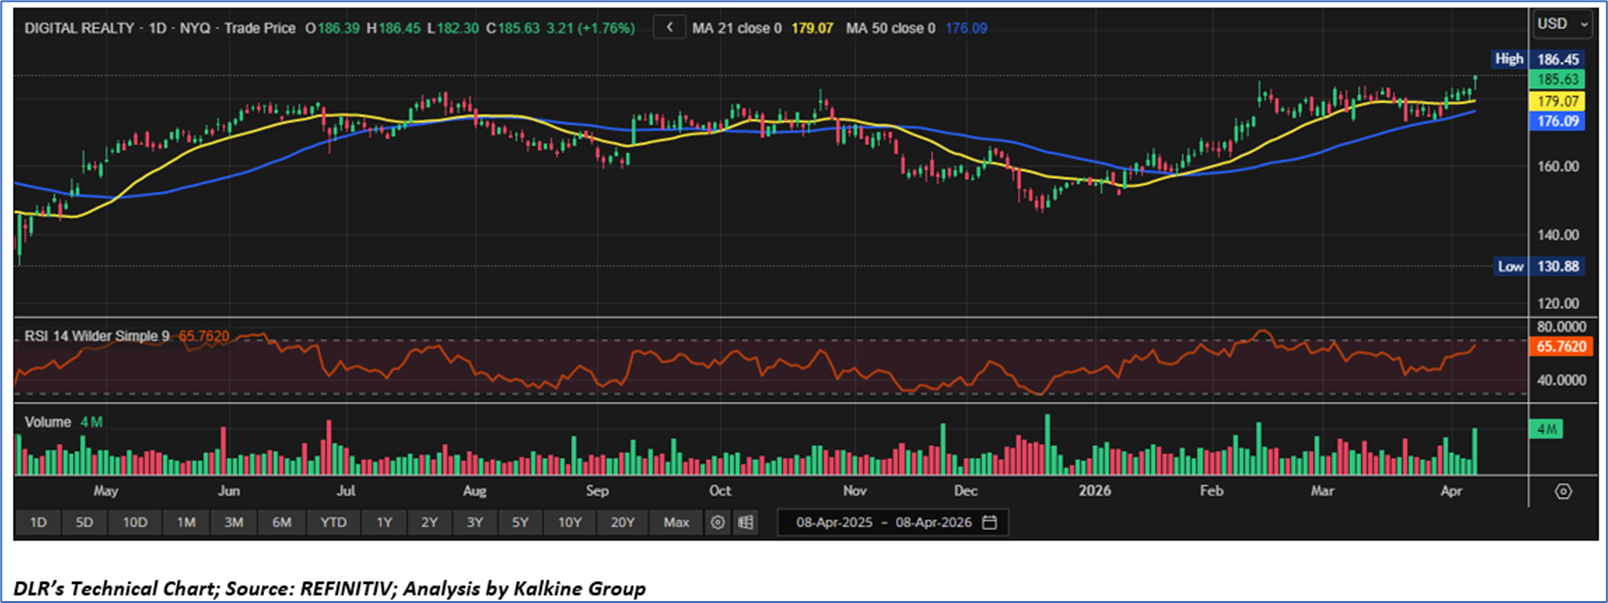
Considering the moderation in near-term earnings momentum (with quarterly net income per share declining year-over-year), the capital-intensive nature of growth requiring elevated and ongoing development CapEx, a relatively high leverage profile with sensitivity to interest rates and refinancing conditions, execution risks associated with leasing backlog conversion and delayed revenue realization, and moderate organic growth outlook despite strong demand tailwinds, a ‘Sell’ rating is assigned to the ‘DLR’ at the closing market price of USD 185.63, as of April 08, 2026.
Note: This report may be updated with details around fundamental and technical analysis, price chart in due course, as appropriate.
Note 1: Past performance is not a reliable indicator of future performance.
Note 2: The reference date for all price data, currency, technical indicators, support, and resistance level is April 08, 2026. The reference data in this report has been partly sourced from REFINITIV.
Note 3: Investment decisions should be made depending on an individual's appetite for upside potential, risks, holding duration, and any previous holdings. An 'Exit' from the stock can be considered if the Target Price mentioned as per the Valuation and or the technical levels provided has been achieved and is subject to the factors discussed above.
Note 4: Target Price refers to a price level that the stock is expected to reach as per the relative valuation method and or technical analysis taking into consideration both short-term and long-term scenarios.
Note 5: ‘Kalkine reports are prepared based on the stock prices captured either from the New York Stock Exchange (NYSE), NASDAQ Capital Markets (NASDAQ), and or REFINITIV. Typically, all sources (NYSE, NASDAQ, or REFINITIV) may reflect stock prices with a delay which could be a lag of 15-20 minutes. There can be no assurance that future results or events will be consistent with the information provided in the report. The information is subject to change without any prior notice.

 CA
 NZ
 UK
 US
 IND

 AU

 Please wait processing your request...