W&T Offshore, Inc.
W&T Offshore, Inc. (NYSE: WTI) is an independent offshore oil and natural gas producer operating in the Gulf of America. The Company holds working interests in approximately 52 fields across federal and state waters and controls around 646,200 gross acres (502,300 net acres) along the U.S. outer continental shelf, including conventional shelf and deepwater assets. Its operations and asset ownership are primarily structured through wholly owned subsidiaries and a proportionately consolidated interest in Monza Energy LLC.

Revenue and Production Performance
- Production Growth and Volume Mix: During Q3 FY25, the Company delivered total sales volumes of 3,275 MBoe, equivalent to an average daily production of 35.6 MBoe/d, reflecting a meaningful increase over the prior-year period. Production growth was primarily driven by contributions from recently acquired assets and continued optimization initiatives across existing fields. Liquids accounted for a substantial portion of total output, supporting revenue resilience despite commodity price volatility. The quarter marked continued sequential improvement in production, reinforcing operational momentum.
- Revenue Realization and Pricing Trends: Total revenues for Q3 FY25 amounted to USD 127.5 million, compared with USD 121.4 million in Q3 FY24. The improvement was largely attributable to higher production volumes, partially offset by softer realized commodity prices. The Company reported an average realized price of USD 38.33 per Boe before derivative settlements, reflecting moderation in oil and NGL pricing relative to the prior-year quarter. Oil revenues remained the primary contributor to total sales, supported by steady realized oil prices during the period.
Cost Structure and Operating Efficiency
- Lease Operating Expenses and Unit Economics: Lease operating expenses (LOE) totaled USD 76.2 million in Q3 FY25, compared with USD 72.4 million in Q3 FY24. While absolute LOE increased year-over-year due to higher production volumes and incremental workover activities, unit LOE improved sequentially, reflecting operational efficiencies and cost discipline. On a per-unit basis, LOE declined compared to the immediately preceding quarter, demonstrating enhanced field-level cost management.
- Depreciation, Accretion and Administrative Costs: Depreciation, depletion and amortization (DD&A) expense for the quarter amounted to USD 28.6 million, lower than USD 34.2 million in Q3 FY24, reflecting reserve revaluation and production mix changes. Asset retirement obligation accretion expense totaled USD 8.0 million during the quarter. General and administrative expenses increased to USD 21.5 million from USD 19.7 million in the prior-year quarter, primarily due to higher non-cash stock-based compensation, while cash G&A remained relatively stable.
Profitability and Earnings Performance
- Operating and Net Income Performance: The Company reported an operating loss of USD 12.6 million in Q3 FY25, an improvement from the operating loss of USD 19.0 million in Q3 FY24. Net loss for the quarter widened to USD 71.5 million compared with USD 36.9 million in Q3 FY24. The increase in net loss was primarily driven by a non-cash income tax expense of USD 56.0 million related to a valuation allowance on deferred tax assets. Excluding this non-recurring adjustment, underlying performance reflected operational improvement supported by production growth and disciplined cost control.
- Derivative and Interest Expense Impact: During Q3 FY25, the Company recorded a net derivative gain of USD 4.1 million, reflecting realized gains partially offset by unrealized mark-to-market losses. Net interest expense totaled USD 9.0 million, slightly lower than the prior-year period due to refinancing initiatives undertaken earlier in FY25. The refinancing of higher-cost debt instruments contributed to improved capital structure stability.
Balance Sheet, Liquidity and Capital Structure
- Liquidity Position and Debt Management: As of September 30, 2025, the Company reported cash and cash equivalents of USD 124.8 million, representing an increase from year-end 2024 levels. Total debt stood at approximately USD 350.4 million following the issuance of 10.75% Senior Second Lien Notes and the retirement of prior debt facilities during FY25. Net debt declined meaningfully compared to year-end levels, reflecting improved liquidity and disciplined capital allocation. The Company remained in compliance with its debt covenants and maintained access to additional liquidity under its revolving credit facility.
Key Risks:
- Commodity Price Volatility: Earnings and cash flows remain highly sensitive to fluctuations in crude oil and natural gas prices, which directly impact realized revenues and reserve valuations.
- Offshore Operational and Weather Risks: Concentration of assets in the Gulf of America exposes the Company to hurricane activity, production disruptions, and higher maintenance and insurance costs.
- Decommissioning and Asset Retirement Obligations: Significant long-term asset retirement liabilities could pressure liquidity, particularly if regulatory requirements or cost estimates increase.
- Leverage and Refinancing Exposure: Although debt has been refinanced, the Company maintains a relatively leveraged capital structure, which may limit financial flexibility during periods of lower commodity prices.
Technical Observation (on the daily chart):
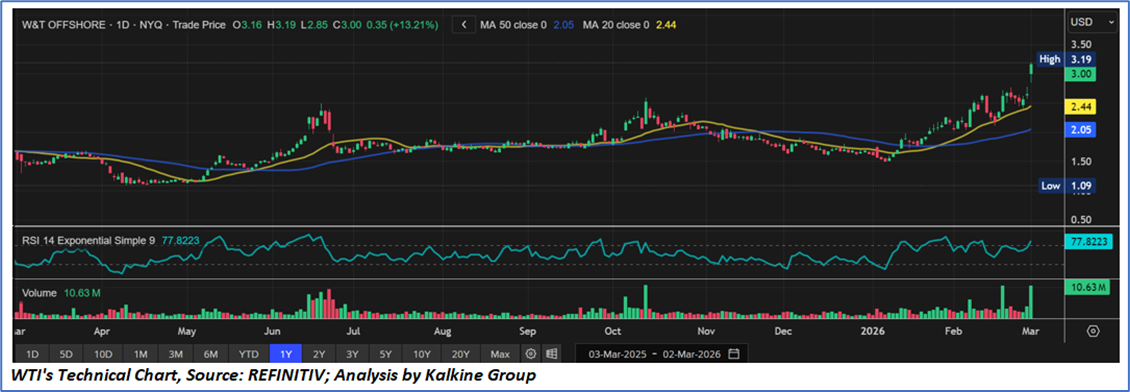
- The stock has broken above the prior swing high near USD 3.00 and is currently trading around USD 3.19, marking a fresh 52-week high. This breakout is accompanied by expanding volume, indicating strong participation and momentum confirmation.
- The 20-day moving average (USD 2.44) is trending above the 50-day moving average (USD 2.05), with price trading well above both averages. This alignment reflects a well-established short-term uptrend and improving intermediate momentum.
- The 14-day RSI is near 78, suggesting overbought conditions. While this confirms strong bullish momentum, it also raises the probability of short-term consolidation or a minor pullback before continuation.
- Recent sessions show a noticeable spike in volume compared to prior weeks, reinforcing the validity of the breakout and suggesting institutional accumulation
In Q3 FY25, W&T Offshore demonstrated operational strength through production growth and improved unit economics, while strengthening its balance sheet via refinancing and liquidity enhancement. Although reported net loss expanded due to a significant non-cash tax adjustment, underlying operational metrics showed measurable improvement compared to the prior-year quarter, positioning the Company with improved financial flexibility entering the subsequent periods.
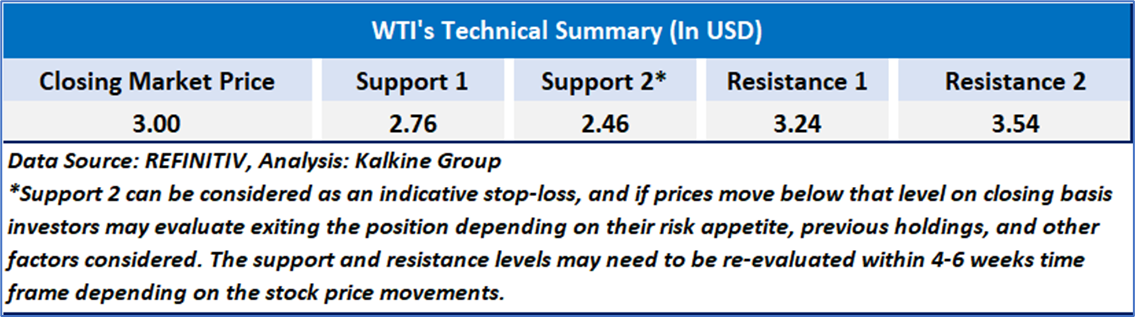
As per the above-mentioned price action, recent key business and financial updates, momentum in the stock over the last month, and technical indicators analysis, a ‘Speculative Buy’ rating has been given to W&T Offshore, Inc. (NYSE: WTI) at the closing market price of USD 3.00, as of March 02,2026.

Individuals can evaluate the stock based on the support and resistance levels provided in the report in case of keen interest taking into consideration the risk-reward scenario.
Markets are trading in a highly volatile zone currently due to certain macro-economic issues and prevailing geopolitical tensions. Therefore, it is prudent to follow a cautious approach while investing.
Related Risk: This report may be looked at from a high-risk perspective and a recommendation is provided for a short duration. This report is solely based on technical parameters, and the fundamental performance of the stocks has not been considered in the decision-making process. Other factors which could impact the stock prices include market risks, regulatory risks, interest rates risks, currency risks, social and political instability risks etc.
Note 1: Past performance is not a reliable indicator of future performance.
Note 2: The reference date for all price data, currency, technical indicators, support, and resistance level is March 02,2026. The reference data in this report has been partly sourced from REFINITIV.
Note 3: Investment decisions should be made depending on an individual's appetite for upside potential, risks, holding duration, and any previous holdings. An 'Exit' from the stock can be considered if the Target Price mentioned as per the Valuation and or the technical levels provided has been achieved and is subject to the factors discussed above.
Note 4: Target Price refers to a price level that the stock is expected to reach as per the relative valuation method and or technical analysis taking into consideration both short-term and long-term scenarios.
Note 5: ‘Kalkine reports are prepared based on the stock prices captured either from the New York Stock Exchange (NYSE), NASDAQ Capital Markets (NASDAQ), and or REFINITIV. Typically, all sources (NYSE, NASDAQ, or REFINITIV) may reflect stock prices with a delay which could be a lag of 15-20 minutes. There can be no assurance that future results or events will be consistent with the information provided in the report. The information is subject to change without any prior notice.

 CA
 NZ
 UK
 US
 IND

 AU

 Please wait processing your request...