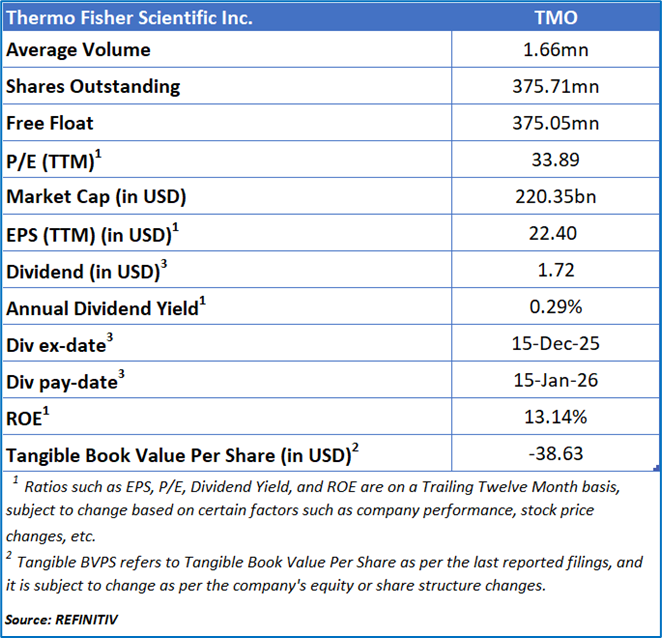
Thermo Fisher Scientific Inc.
Thermo Fisher Scientific Inc. (NYSE: TMO) is dedicated to driving progress in life sciences research, solving complex analytical challenges, improving laboratory productivity, and advancing patient care through innovative diagnostics and the development and manufacturing of groundbreaking therapies.
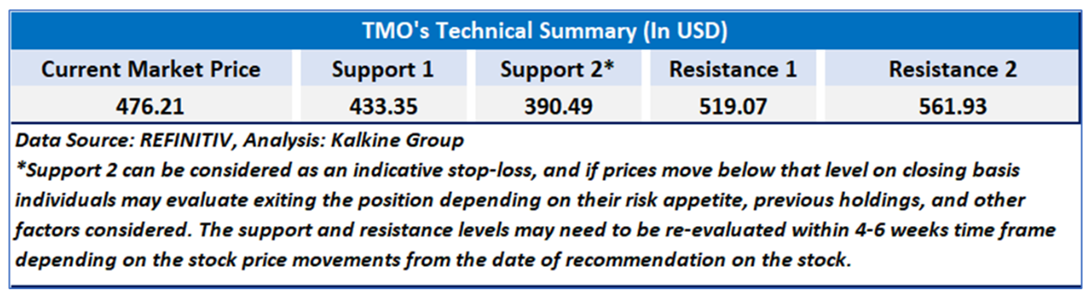
As per previous Kalkine’s Low Carbon Research Report published on ‘TMO’ on Jul 25, 2025, Kalkine provided an ‘Buy’ stance on the stock at USD 476.21 based on fundamental analysis and the stock price has now moved up by ~ 23.73% since then.
Noted below are the details of support and resistance levels provided in our previous report:
Rationale:
- Moderation in Organic Revenue Growth: Despite a solid top-line expansion of 5% year-over-year, Thermo Fisher Scientific’s organic revenue growth of 3% indicates a moderation in the company’s core business momentum. This slowdown suggests that a portion of revenue growth was driven by acquisitions rather than underlying demand strength. The deceleration may reflect ongoing macroeconomic pressures in global research and healthcare spending, as well as the normalization of post-pandemic demand trends across bioproduction and analytical instruments. Sustaining higher organic growth levels remains a key challenge for the company, particularly in mature markets.
- Margin Constraints Amid Cost Pressures: Although operating margins showed a slight improvement, rising from 17.3% to 17.4% on a GAAP basis, the minimal expansion highlights continued cost pressures across operations. The company’s heavy investment in innovation, manufacturing expansion, and AI-driven transformation initiatives has likely weighed on near-term profitability. Additionally, increased input costs, supply chain adjustments, and integration expenses from recent acquisitions have restrained margin improvement. Maintaining margin resilience while pursuing aggressive growth and acquisition strategies poses a potential risk to earnings stability.
- Dependence on Acquisitions for Growth: Thermo Fisher’s performance continues to be bolstered by its acquisition-led growth strategy, as evidenced by the recent purchases of Solventum’s Filtration and Separation business and Sanofi’s Ridgefield fill-finish site. While these acquisitions enhance strategic positioning, they also highlight a structural reliance on inorganic growth to sustain revenue momentum. This dependence may expose the company to integration challenges, higher leverage, and execution risks, especially if acquired entities fail to deliver expected synergies or revenue contributions in the short term.
- Limited GAAP Earnings Expansion: While adjusted EPS grew 10% year-over-year, GAAP diluted EPS increased only marginally from USD 4.25 to USD 4.27, reflecting limited bottom-line growth under generally accepted accounting principles. The divergence between GAAP and adjusted results underscores the impact of acquisition-related amortization, restructuring, and other non-recurring costs on reported earnings. This gap may concern investors focusing on sustainable profitability and transparency, as it indicates that a portion of earnings growth stems from adjustments rather than core operating improvements.
- Rising Capital Allocation and Execution Risks: Thermo Fisher’s active capital deployment—including USD 1.0 billion in share repurchases and multiple strategic acquisitions during the quarter—underscores its strong balance sheet but also elevates financial execution risks. Frequent capital outlays increase exposure to interest rate fluctuations, integration complexities, and potential dilution of return on invested capital (ROIC). Furthermore, balancing shareholder returns with long-term investments in innovation, AI integration, and capacity expansion could pressure cash flows if macroeconomic or end-market conditions weaken in the coming quarters.
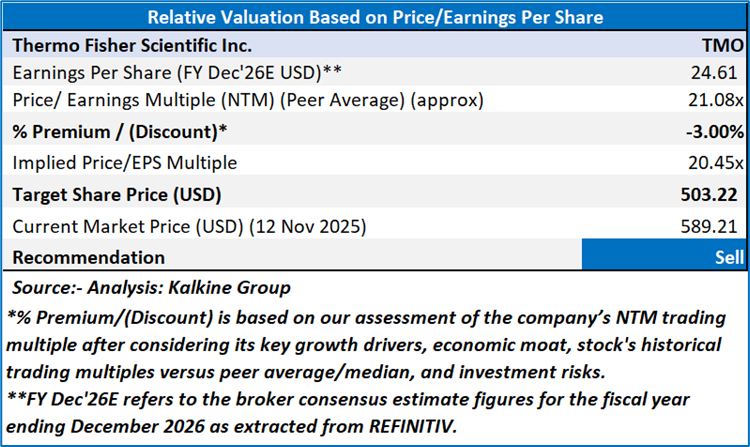
Valuation (Using Price/Earnings per share Multiple)
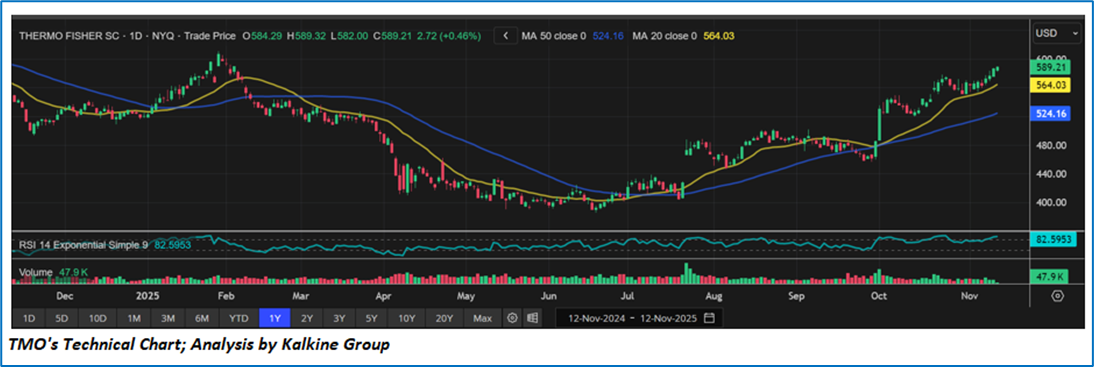
Share Price Chart
Conclusion
Thermo Fisher Scientific’s third-quarter performance, while operationally solid, reveals underlying challenges that temper its growth outlook. The slowdown in organic revenue growth to 3% indicates softer core demand, while only marginal improvement in GAAP margins and earnings highlights persistent cost pressures and limited profitability expansion. The company’s reliance on acquisitions to sustain growth raises integration and execution risks, and the widening gap between GAAP and adjusted results suggests that part of the earnings momentum is non-recurring. Moreover, increased capital deployment toward acquisitions and share repurchases heightens financial exposure, signaling potential pressure on future cash flows and returns.
Based on the notional gains, valuation downside and price action stance, a "Sell" recommendation on Thermo Fisher Scientific Inc. (NYSE: TMO) has been given at the current market price of USD 589.21 as on 12 November 2025 at 9:20 am PST.
Note 1: Past performance is not a reliable indicator of future performance.
Note 2: The reference date for all price data, currency, technical indicators, support, and resistance level is 12 November 2025. The reference data in this report has been partly sourced from REFINITIV.
Note 3: Investment decisions should be made depending on an individual's appetite for upside potential, risks, holding duration, and any previous holdings. An 'Exit' from the stock can be considered if the Target Price mentioned as per the Valuation and or the technical levels provided has been achieved and is subject to the factors discussed above.
Note 4: Target Price refers to a price level which the stock is expected to reach as per the relative valuation method and/or technical analysis taking into consideration both short-term and long-term scenario.
Note 5: ‘Kalkine reports are prepared based on the stock prices captured either from the London Stock Exchange (LSE) and or REFINITIV. Typically, both sources (LSE and or REFINITIV) may reflect stock prices with a delay which could be a lag of 15-20 minutes. There can be no assurance that future results or events will be consistent with the information provided in the report. The information is subject to change without any prior notice.’
Note 6: Dividend Yield may vary as per the stock price movement.

 CA
 NZ
 UK
 US
 IND

 AU

 Please wait processing your request...