Bank of America Corporation
Bank of America Corporation (NYSE: BAC) operates as both a bank holding company and a financial holding company. It is organized into several segments: Consumer Banking, Global Wealth & Investment Management (GWIM), Global Banking, and Global Markets. The Consumer Banking segment provides a variety of credit, banking, and investment solutions tailored to individual consumers and small businesses.
- Robust Overall Financial Results: Bank of America reported a net income of USD 6.7 billion, or USD 0.82 per diluted share, for the fourth quarter of 2024, compared to USD 3.1 billion, or USD 0.35 per share, in the same period of 2023. Total revenue, net of interest expense, reached USD 25.3 billion, representing a 15% year-over-year increase. Net interest income rose 3% to USD 14.4 billion, driven by loan growth, fixed-rate asset repricing, and favorable deposit trends, despite the impact of lower interest rates. The bank's full-year 2024 net income was USD 27.1 billion, with total revenue surpassing USD 100 billion, supported by strong fee income and balanced growth across business segments.
- Consumer Banking Growth and Digital Expansion: The Consumer Banking segment delivered a net income of USD 2.8 billion on revenue of USD 10.6 billion, up 3% from the prior year. While average deposits declined 2% year-over-year to USD 942 billion, they remained 31% above pre-pandemic levels. Average loans and leases increased to USD 316 billion, and total credit and debit card spending rose 5% to USD 241 billion. Digital engagement also strengthened, with 48 million active digital users and 3.9 billion digital logins. Notably, 61% of total sales were completed through digital platforms, with Zelle® transactions up 24% to 424 million.
- Wealth Management Performance and Client Expansion: Global Wealth and Investment Management (GWIM) posted a net income of USD 1.2 billion, with revenue increasing 15% to USD 6.0 billion. This growth was primarily driven by a 23% rise in asset management fees resulting from higher market valuations and strong AUM inflows. Client balances rose to USD 4.3 trillion, reflecting a 12% year-over-year gain. GWIM also recorded 4,600 new client relationships across Merrill and the Private Bank, and assets under management reached USD 1.9 trillion, up 16%. Additionally, 77% of Merrill accounts were opened digitally.
- Strong Momentum in Global Banking: The Global Banking segment achieved a net income of USD 2.1 billion. Investment banking fees (excluding self-led deals) rose 44% to USD 1.7 billion, helping the bank secure a #3 ranking in market share for fees with a 116 basis point gain. Average deposits increased 10% to USD 582 billion, while Middle Market loan balances grew 5%. These results highlight the bank's strengthened position in investment banking and its continued success in attracting deposits and extending credit to business clients.
- Global Markets Deliver Consistent Trading Growth: Bank of America's Global Markets segment reported a net income of USD 941 million. Sales and trading revenue grew 13% year-over-year to USD 4.1 billion, with fixed income, currencies, and commodities (FICC) revenue up 19% to USD 2.5 billion. Equities revenue increased 7% to USD 1.6 billion. This marks the 11th consecutive quarter of year-over-year growth in sales and trading, underpinned by strong performance across asset classes and continued client demand.
- Maintaining Capital Strength and Shareholder Returns: The bank’s balance sheet remained solid with average deposits of USD 1.96 trillion and average loans and leases of USD 1.08 trillion, both increasing 3% from the previous quarter. The Common Equity Tier 1 (CET1) capital rose to USD 201 billion, with a CET1 ratio of 11.9%, well above regulatory requirements. In the fourth quarter alone, Bank of America returned USD 5.5 billion to shareholders through dividends and share repurchases, contributing to a total of USD 21 billion returned over the full year.
- Strategic Outlook and Operational Efficiency: Bank of America improved its operating efficiency, reflected in a 5% year-over-year decline in noninterest expense to USD 16.8 billion, aided by the absence of the prior year’s FDIC special assessment. Asset quality remained healthy with a provision for credit losses of USD 1.5 billion. Leadership highlighted confidence heading into 2025, citing broad revenue growth, operating leverage, and a favorable economic environment. CEO Brian Moynihan emphasized the company's positioning for continued success, while CFO Alastair Borthwick pointed to ongoing NII growth and disciplined capital management.
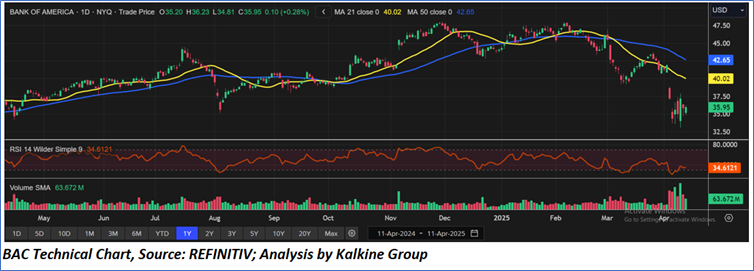
Technical Observation (on the daily chart):
Bank of America (BAC) has been in a downtrend since February 2025, recently bouncing from the USD 33–USD 34 area, suggesting potential short-term support. The price is trading below both the 21-day and 50-day moving averages, with a bearish crossover (death cross) forming in March. The RSI of 34.61 indicates near-oversold conditions, and recent volume spikes suggest a potential rebound or short-covering rally. Key support is around USD 33.50–USD 34, while resistance levels are at USD 37.50, USD 40, and USD 42.65. Traders should watch for a reclaim of the 21-day MA or a break below USD 33 for further downside.
Bank of America concluded 2024 with strong financial performance, reporting a fourth-quarter net income of USD 6.7 billion and full-year earnings of USD 27.1 billion. Revenue surpassed USD 100 billion for the year, driven by growth across all major business segments including Consumer Banking, Wealth Management, Global Banking, and Markets. The bank saw increased client activity, robust digital engagement, and record levels of investment assets. With improved operating leverage, disciplined expense management, and a solid capital position, Bank of America enters 2025 well-positioned to support client growth and deliver long-term value to shareholders in a stable economic environment.
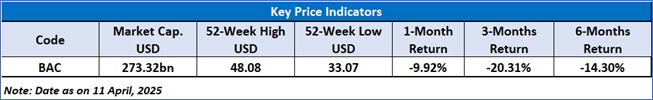
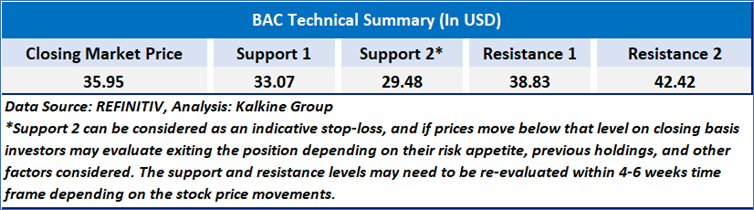
As per the above-mentioned price action, recent key business and financial updates, momentum in the stock over the last month, and technical indicators analysis, a ‘Watch’ rating has been given to Bank of America Corporation (NYSE: BAC) at the closing market price of USD 35.95 as of April 11,2025.
Individuals can evaluate the stock based on the support and resistance levels provided in the report in case of keen interest taking into consideration the risk-reward scenario.
Markets are trading in a highly volatile zone currently due to certain macro-economic issues and prevailing geopolitical tensions. Therefore, it is prudent to follow a cautious approach while investing.
Related Risk: This report may be looked at from a high-risk perspective and a recommendation is provided for a short duration. This report is solely based on technical parameters, and the fundamental performance of the stocks has not been considered in the decision-making process. Other factors which could impact the stock prices include market risks, regulatory risks, interest rates risks, currency risks, social and political instability risks etc.
Note 1: Past performance is not a reliable indicator of future performance.
Note 2: The reference date for all price data, currency, technical indicators, support, and resistance level is April 11,2025. The reference data in this report has been partly sourced from REFINITIV.
Note 3: Investment decisions should be made depending on an individual's appetite for upside potential, risks, holding duration, and any previous holdings. An 'Exit' from the stock can be considered if the Target Price mentioned as per the Valuation and or the technical levels provided has been achieved and is subject to the factors discussed above.
Note 4: Target Price refers to a price level that the stock is expected to reach as per the relative valuation method and or technical analysis taking into consideration both short-term and long-term scenarios.
Note 5: ‘Kalkine reports are prepared based on the stock prices captured either from the New York Stock Exchange (NYSE), NASDAQ Capital Markets (NASDAQ), and or REFINITIV. Typically, all sources (NYSE, NASDAQ, or REFINITIV) may reflect stock prices with a delay which could be a lag of 15-20 minutes. There can be no assurance that future results or events will be consistent with the information provided in the report. The information is subject to change without any prior notice.
 AU
AU
-Copy_04_14_2025_14_02_52_911797.jpg)
 Please wait processing your request...