ChargePoint Holdings Inc
ChargePoint Holdings, Inc. (NYSE: CHPT) is an electric vehicle (EV) charging technology solutions provider. The Company sells networked charging hardware, connected through cloud-based software services (Cloud Services) and extended parts and labor warranty solutions (Assure) to customers to enable charging system owners, or hosts, to manage their networked charging systems, and enable drivers to locate, reserve and authenticate networked charging systems, and to transact EV charging sessions on those systems.
Recent Financial and Business Updates:
- ChargePoint Financial Report and Conference Call Announcement: ChargePoint (NYSE: CHPT), a prominent provider of networked solutions for electric vehicle (EV) charging, disclosed its plan to unveil the financial results for the fourth quarter and full fiscal year 2024 on March 5, 2024. The conference call to discuss these results is scheduled for 1:30 p.m. Pacific time (4:30 p.m. Eastern time) on the same day.
- Preliminary Financial Results Overview: Reaffirming the preliminary financial results revealed on November 16, 2023, ChargePoint reported a 12% year-over-year decrease in third-quarter fiscal 2024 revenue, amounting to USD 110 million. The GAAP gross margin was negative 22%, with a non-GAAP gross margin of negative 18%, primarily impacted by a USD 42 million inventory impairment charge. Operating expenses reflected a GAAP expense of USD 130 million and a non-GAAP expense of USD 81 million, aligning with previously announced cost-saving measures. ChargePoint remains committed to achieving positive non-GAAP Adjusted EBITDA in the fourth quarter of the calendar year 2024 (Fourth quarter of fiscal 2025).
- Third Quarter Fiscal 2024 Financial Snapshot: The third-quarter revenue reached USD 110.3 million, marking a 12% decline from the prior year's corresponding quarter. Networked charging systems revenue was USD 73.9 million, down 24%, while subscription revenue increased by 41% to USD 30.6 million. The GAAP and non-GAAP gross margins were adversely affected, reaching negative 22% and negative 18%, respectively, due to a USD 42 million inventory impairment charge. The GAAP net loss for the quarter was USD 158.2 million, compared to USD 84.5 million in the same period the previous year. Non-GAAP pre-tax net loss and Non-GAAP Adjusted EBITDA Loss both reflected the inventory impairment charge, standing at USD 106.3 million and USD 97.4 million, respectively. ChargePoint's liquidity position, as of October 31, 2023, was robust with USD 397.4 million in cash, cash equivalents, and restricted cash, including USD 233.1 million from at-the-market share offerings during the third quarter. The company's shares outstanding totaled approximately 418 million as of October 31, 2023. The company retains a solid financial position with an undrawn USD 150 million revolving credit facility and no debt maturities until 2028.
Technical Observation (on the daily chart)
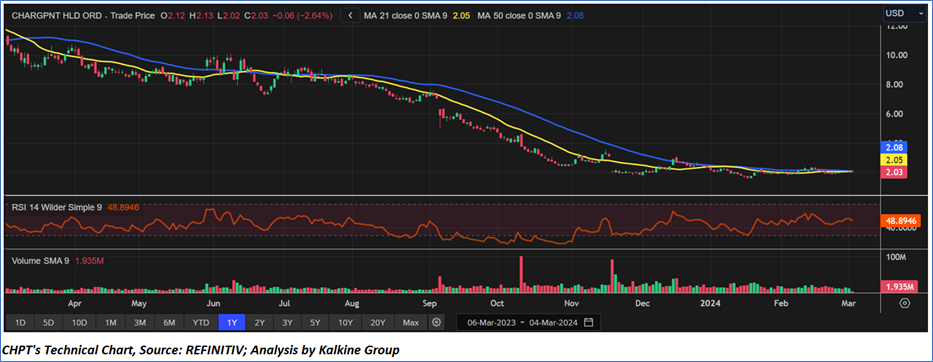
The Relative Strength Index (RSI), calculated over a 14-day span, stands at 48.89, currently upward trending, signifying the likelihood of either more consolidation or an upward momentum. Adding to this, the stock presently finds itself positioned below both the 21-day and 50-day Simple Moving Averages (SMA), which could function as a dynamic short-term resistance levels. Now, the stock's price is currently near a support zone of USD 1.80-USD 2.00, with expectations of an upside movement from the support levels.
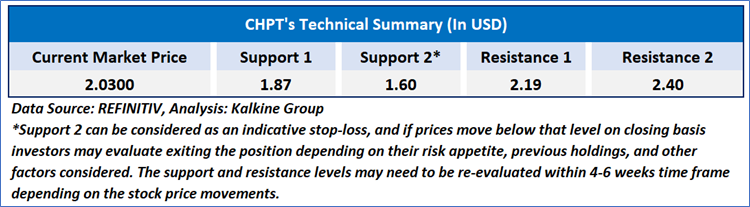

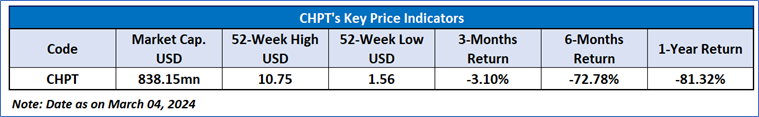
As per the above-mentioned price action, recent key business and financial updates, momentum in the stock over the last month, and technical indicators analysis, a ‘Speculative Buy’ rating has been given to ChargePoint Holdings, Inc. (NYSE: CHPT) at the current market price of USD 2.03, as of March 04, 2024, at 07:30 am PST.
Individuals can evaluate the stock based on the support and resistance levels provided in the report in case of keen interest taking into consideration the risk-reward scenario.
Markets are trading in a highly volatile zone currently due to certain macro-economic issues and prevailing geopolitical tensions. Therefore, it is prudent to follow a cautious approach while investing.
How to Read the Charts?
The yellow colour line reflects the 21-period simple moving average (SMA) while the blue line indicates the 50- period simple moving average (SMA). SMA helps to identify existing price trends. If the prices are trading above the 21-period and 50-period moving average, then it shows prices are currently trading in a bullish trend.
The orange colour line in the chart’s lower segment reflects the Relative Strength Index (14-Period) which indicates price momentum and signals momentum in trend. A reading of 70 or above suggests overbought status while a reading of 30 or below suggests an oversold status.
The red and green colour bars in the chart’s lower segment show the volume of the stock. The volume is the number of shares that changed hands during a given day. Stocks with high volumes are more liquid than stocks with lesser volume as liquidity in stocks helps with easier and faster execution of the order.
The Orange colour lines are the trend lines drawn by connecting two or more price points and used for trend identification purposes. The trend line also acts as a line of support and resistance.
Technical Indicators Defined: -
Support: A level at which the stock prices tend to find support if they are falling, and a downtrend may take a pause backed by demand or buying interest. Support 1 refers to the nearby support level for the stock and if the price breaches the level, then Support 2 may act as the crucial support level for the stock.
Resistance: A level at which the stock prices tend to find resistance when they are rising, and an uptrend may take a pause due to profit booking or selling interest. Resistance 1 refers to the nearby resistance level for the stock and if the price surpasses the level, then Resistance 2 may act as the crucial resistance level for the stock.
Stop-loss: It is a level to protect further losses in case of unfavourable movement in the stock prices.
Abbreviations
CMP: Current Market Price
SMA: Simple Moving Average
RSI: Relative Strength Index
USD: United States dollar
Note 1: Past performance is not a reliable indicator of future performance.
Note 2: The reference date for all price data, currency, technical indicators, support, and resistance levels is March 04, 2024. The reference data in this report has been partly sourced from REFINITIV.
Note 3: Investment decisions should be made depending on an individual's appetite for upside potential, risks, holding duration, and any previous holdings. An 'Exit' from the stock can be considered if the Target Price mentioned as per the Valuation and or the technical levels provided has been achieved and is subject to the factors discussed above.
Note 4: The report publishing date is as per the Pacific Time Zone.
 AU
AU

 Please wait processing your request...