Xpeng Inc.
Xpeng Inc (NYSE: XPEV) is a China-based company engaged in design, development, production, and sales of smart electric vehicles (Smart EV). The Company's primary products are environmentally friendly vehicles, namely an SUV (the G3) and a four-door sports sedan (the P7).
Recent Financial and Business Updates:
- Total Deliveries and Sales Network Expansion: For the first quarter of 2024, XPENG achieved a total of 21,821 vehicle deliveries, marking a 19.7% increase compared to the 18,230 deliveries in the same period of 2023. As of March 31, 2024, XPENG's physical sales network encompassed 574 stores across 178 cities. Additionally, the company's self-operated charging station network expanded to 1,171 stations, including 359 XPENG S4 ultra-fast charging stations.
- Financial Performance and Revenue Analysis: XPENG reported total revenues of RMB6.55 billion (USD0.91 billion) for the first quarter of 2024, reflecting a 62.3% increase from the same period in 2023, but a 49.8% decrease from the fourth quarter of 2023. Revenues from vehicle sales amounted to RMB5.54 billion (USD0.77 billion), representing a 57.8% increase year-over-year, yet a 54.7% decline from the preceding quarter. The gross margin for Q1 2024 was 12.9%, significantly improving from 1.7% in Q1 2023 and 6.2% in Q4 2023. The vehicle margin stood at 5.5%, up from a negative 2.5% in Q1 2023 and 4.1% in Q4 2023.
- Net Loss and Per Share Data: The net loss for the first quarter of 2024 was RMB1.37 billion (USD0.19 billion), an improvement compared to RMB2.34 billion in Q1 2023 and RMB1.35 billion in Q4 2023. On a non-GAAP basis, excluding share-based compensation and fair value gains, the net loss was RMB1.41 billion (USD0.20 billion), compared to RMB2.21 billion in Q1 2023 and RMB1.77 billion in Q4 2023. Basic and diluted net loss per American depositary share (ADS) were both RMB1.45 (USD0.20), with each ADS representing two Class A ordinary shares. Non-GAAP basic and diluted net loss per ADS were both RMB1.49 (USD0.21).
- Liquidity Position: As of March 31, 2024, XPENG held RMB41.40 billion (USD5.73 billion) in cash and cash equivalents, restricted cash, short-term investments, and time deposits. This compares to RMB45.70 billion as of December 31, 2023, encompassing restricted short-term deposits, short-term deposits, restricted long-term deposits, and both the current and non-current portions of long-term deposits.
Technical Observation (on the daily chart)
The Relative Strength Index (RSI) observed over a 14-day period registering at 55.57, currently upward trending with expectations of upward momentum in the stock price. Furthermore, the stock's current position is situated between both the 50-day Simple Moving Average (SMA) and the 200-day SMA, potentially acting as dynamic short-term support and resistance levels respectively. The price is breaking above 50-SMA with decent volume with expectations of upward momentum till next key resistance around USD 9.00-USD 9.50.


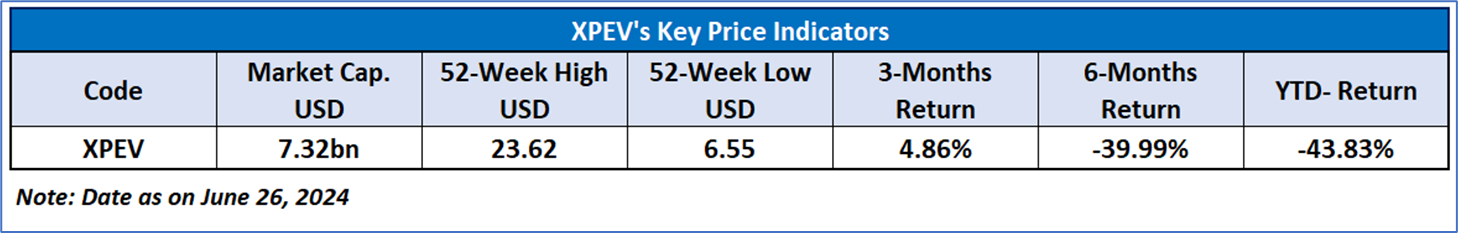
As per the above-mentioned price action, recent key business and financial updates, momentum in the stock over the last month, and technical indicators analysis, a ‘Speculative Buy’ rating has been given to Xpeng Inc (NYSE: XPEV) at the current market price of USD 8.19 as of June 26, 2024, at 10:50 am PDT.
Markets are trading in a highly volatile zone currently due to certain macro-economic issues and prevailing geopolitical tensions. Therefore, it is prudent to follow a cautious approach while investing.
Related Risk: This report may be looked at from a high-risk perspective and a recommendation is provided for a short duration. This report is solely based on technical parameters, and the fundamental performance of the stocks has not been considered in the decision-making process. Other factors which could impact the stock prices include market risks, regulatory risks, interest rates risks, currency risks, social and political instability risks etc.
How to Read the Charts?
The yellow colour line reflects the 21-period simple moving average (SMA) while the blue line indicates the 50- period simple moving average (SMA). SMA helps to identify existing price trends. If the prices are trading above the 21-period and 50-period moving average, then it shows prices are currently trading in a bullish trend.
The orange colour line in the chart’s lower segment reflects the Relative Strength Index (14-Period) which indicates price momentum and signals momentum in trend. A reading of 70 or above suggests overbought status while a reading of 30 or below suggests an oversold status.
The red and green colour bars in the chart’s lower segment show the volume of the stock. The volume is the number of shares that changed hands during a given day. Stocks with high volumes are more liquid than stocks with lesser volume as liquidity in stocks helps with easier and faster execution of the order.
The Orange colour lines are the trend lines drawn by connecting two or more price points and used for trend identification purposes. The trend line also acts as a line of support and resistance.
Technical Indicators Defined: -
Support: A level at which the stock prices tend to find support if they are falling, and a downtrend may take a pause backed by demand or buying interest. Support 1 refers to the nearby support level for the stock and if the price breaches the level, then Support 2 may act as the crucial support level for the stock.
Resistance: A level at which the stock prices tend to find resistance when they are rising, and an uptrend may take a pause due to profit booking or selling interest. Resistance 1 refers to the nearby resistance level for the stock and if the price surpasses the level, then Resistance 2 may act as the crucial resistance level for the stock.
Stop-loss: It is a level to protect further losses in case of unfavourable movement in the stock prices.
The reference date for all price data, currency, technical indicators, support, and resistance levels is June 26, 2024. The reference data in this report has been partly sourced from REFINITIV.
Abbreviations
CMP: Current Market Price
SMA: Simple Moving Average
RSI: Relative Strength Index
USD: United States dollar
Note: Trading decisions require a thorough analysis by individual. Technical reports in general chart out metrics that may be assessed by individuals before any stock evaluation. The above are illustrative analytical factors used for evaluating the stocks; other parameters can be looked at along with additional risks per se. Past performance is neither an indicator nor a guarantee of future performance.
 AU
AU
 Please wait processing your request...