Sprouts Farmers Market, Inc.
SFM Details
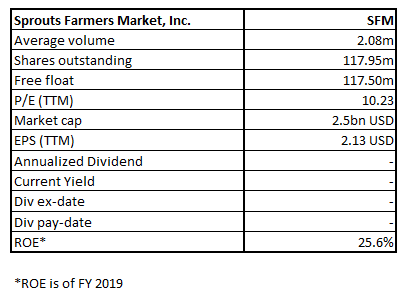
Sprouts Farmers Market (NASDAQ: SFM) operates as the healthy grocery store and offers affordable, fresh, natural as well as organic products.
Update on Results (13-week third quarter ended September 27, 2020)
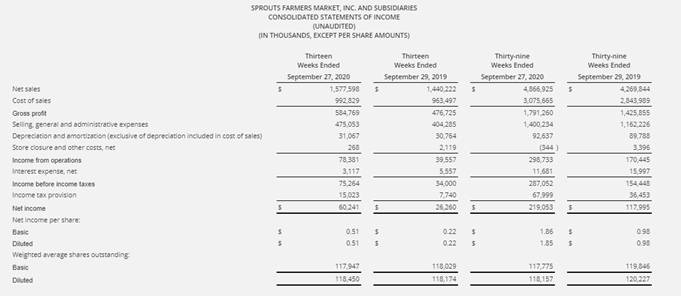
The company stated that net sales for the third quarter of 2020 amounted to $1.6 billion, reflecting a 9.5% rise as compared to the same period in 2019. This growth was because of continued demand from coronavirus pandemic, contributing to 4.2% rise in comparable store sales as well as robust performance in new stores opened. Notably, the company’s gross profit rose by 23% to $585 million.
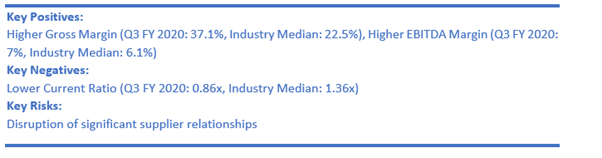
This has led to the gross profit margin of 37.1%, implying a rise of 400 basis points as compared to the same period in 2019. The company’s net income for the quarter stood at $60 million as well as its diluted earnings per share was $0.51, as compared to $26 million and $0.22, respectively, in 2019.
Key Data (Source: Company Reports)
Understanding Liquidity Position
After the company has paid down $176 million of the outstanding debt, it closed Q3 with $275 million in loans along with $34 million of letters of credit outstanding under the revolving credit facility, as well as $138 million in the cash and cash equivalents.
Outlook:
For Q4, the company is anticipating that its comparable store sales would be in the low single digits and inclusive of 53rd week, adjusted diluted EPS would be in the range of $0.36 to $0.40, which implies the full-year adjusted diluted EPS range of between $2.26 to $2.30, on the 53-week basis. The company is focused towards maintaining the momentum it has managed to capture in 2020, which gives the confidence that its earnings before interest and taxes in 2021 is expected to be between $285 million- $305 million.
Valuation Methodology: P/E Based Relative Valuation (Illustrative)
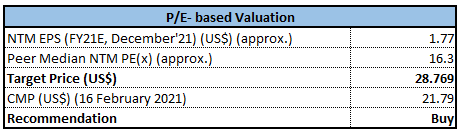
P/E Based Relative Valuation (Source: Refinitiv (Thomson Reuters))
Note: All forecasted figures and peers have been taken from Thomson Reuters, NTM-Next Twelve Months
Technical Overview:
Weekly Chart:
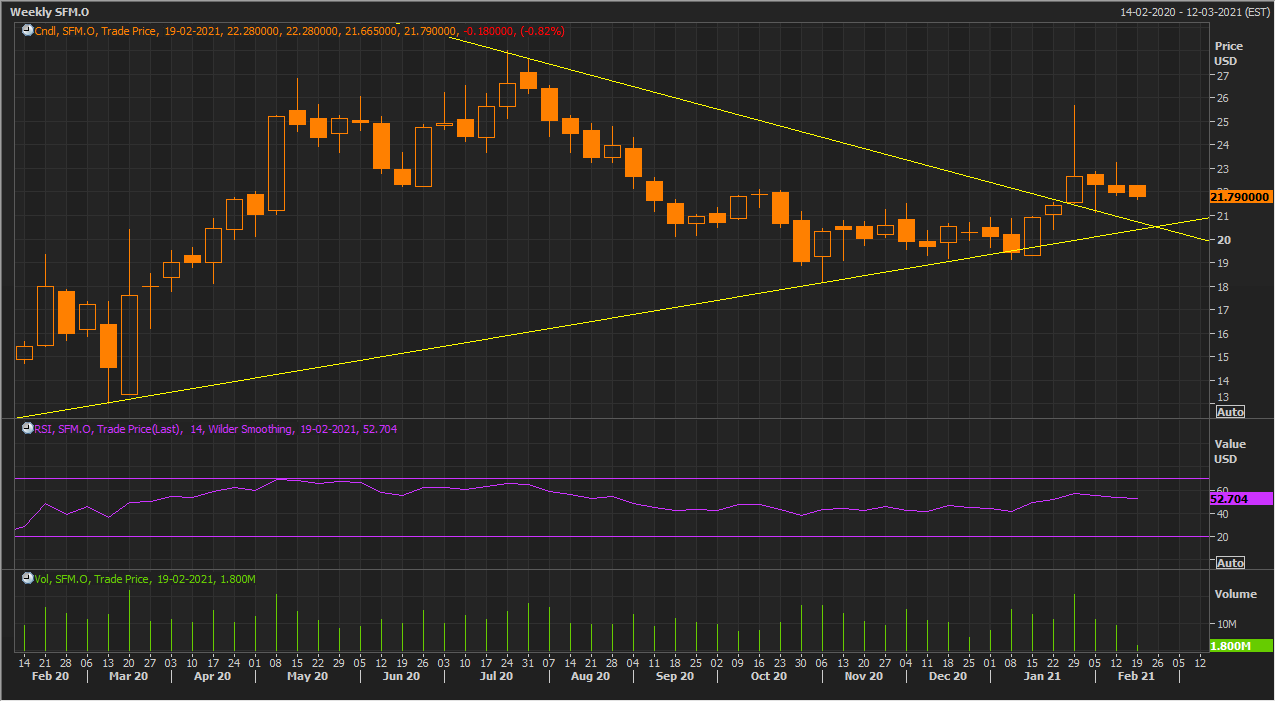
(Source: Refinitiv (Thomson Reuters))
Note: Yellow color line indicates trend-line while purple color line depicts RSI Levels. Green lines are indicating volumes on a weekly basis.
SFM is trading in a primary bullish trend. The stock prices broke symmetrical triangle breakout pattern on a weekly chart and are sustaining above the breakout from the last 4 weeks. RSI (14) is hovering at ~53 that is further supportive to the stock's prices. Prices are now witnessing some correction with weaker volumes and it appears to be that the prices might regain the strength in the upcoming trading sessions. An immediate support level for the stock price is $20.40 while an immediate resistance level is $25.67.
Stock Recommendation:
In Q3 FY 2020, the company posted EBITDA margin of 7%, which is higher as compared to the industry median of 6.1%. The company managed to generate cash from operations of $410 million year-to-date through September 27, 2020 as well as deployed $76 million in the capital expenditures net of landlord reimbursements, primarily for the new stores.
We have applied P/E multiple Based relative valuation (on an illustrative basis) and the target price reflects a rise of low double-digit (in % terms).
Thus, we give a “Buy” recommendation on the stock at the current price of US$21.79 per share, down by 0.82% on February 16, 2021.
Disclaimer
The advice given by Kalkine Pty Ltd and provided on this website is general information only and it does not take into account your investment objectives, financial situation or needs. You should therefore consider whether the advice is appropriate to your investment objectives, financial situation and needs before acting upon it. You should seek advice from a financial adviser, stockbroker or other professional (including taxation and legal advice) as necessary before acting on any advice. Not all investments are appropriate for all people. Kalkine.com.au and associated pages are published by Kalkine Pty Ltd ABN 34 154 808 312 (Australian Financial Services License Number 425376). The information on this website has been prepared from a wide variety of sources, which Kalkine Pty Ltd, to the best of its knowledge and belief, considers accurate. You should make your own enquiries about any investments and we strongly suggest you seek advice before acting upon any recommendation. Kalkine Pty Ltd has made every effort to ensure the reliability of information contained in its newsletters and websites. All information represents our views at the date of publication and may change without notice. To the extent permitted by law, Kalkine Pty Ltd excludes all liability for any loss or damage arising from the use of this website and any information published (including any indirect or consequential loss, any data loss or data corruption). If the law prohibits this exclusion, Kalkine Pty Ltd hereby limits its liability, to the extent permitted by law to the resupply of services. There may be a product disclosure statement or other offer document for the securities and financial products we write about in Kalkine Reports. You should obtain a copy of the product disclosure statement or offer document before making any decision about whether to acquire the security or product. The link to our Terms & Conditions has been provided please go through them and also have a read of the Financial Services Guide. On the date of publishing this report (mentioned on the website), employees and/or associates of Kalkine Pty Ltd do not hold positions in any of the stocks covered on the website. These stocks can change any time and readers of the reports should not consider these stocks as personalised advice.
 AU
AU
 Please wait processing your request...