iQIYI, Inc
iQIYI, Inc (NASDAQ: IQ) is a leading provider of online entertainment video services in China, listed on the NASDAQ under the ticker symbol IQ. The company combines creative talent with technology to foster innovation and produce blockbuster content. It operates a diversified business model that includes membership services, online advertising, content distribution, online games, IP licensing, talent agency, online literature, and more.
Recent Business and Financial Updates
- Financial Performance in the Fourth Quarter of 2024: For the fourth quarter of 2024, iQIYI reported total revenues of RMB 6.61 billion (USD 906.0 million), marking a 14% year-over-year decline, driven by reduced income from membership services, online advertising, content distribution, and other revenues. Operating income decreased to RMB 285.4 million (USD 39.1 million) with a 4% margin, down from RMB 773.7 million and a 10% margin in the prior year, while non-GAAP operating income stood at RMB 405.9 million (USD 55.6 million) with a 6% margin, compared to RMB 927.8 million and a 12% margin. The company recorded a net loss attributable to iQIYI of RMB 189.4 million (USD 25.9 million), a shift from a net income of RMB 466.2 million in 2023, with non-GAAP net loss at RMB 58.8 million (USD 8.1 million) versus a non-GAAP net income of RMB 682.0 million, reflecting challenges including foreign exchange losses.
- Fiscal Year 2024 Financial Overview: For the full fiscal year 2024, iQIYI’s total revenues amounted to RMB 29.23 billion (USD 4.00 billion), an 8% decrease from 2023, despite varied performance across revenue categories. Operating income fell to RMB 1.81 billion (USD 248.1 million) with a 6% margin, down from RMB 2.99 billion and a 9% margin, while non-GAAP operating income was RMB 2.36 billion (USD 323.6 million) with an 8% margin, compared to RMB 3.64 billion and an 11% margin. Net income attributable to iQIYI declined 60% to RMB 764.1 million (USD 104.7 million) from RMB 1.93 billion, with non-GAAP net income dropping 47% to RMB 1.51 billion (USD 207.2 million) from RMB 2.84 billion, indicating a challenging year influenced by a lighter content slate and market dynamics.
- Strategic and Operational Insights: Yu Gong, iQIYI’s Founder, Director, and Chief Executive Officer, noted the launch of blockbuster content since late November 2024, which bolstered the company’s leading position in the drama market and drove a significant increase in subscribing members into 2025. The company also made notable progress in its mini-drama segment, expanding its portfolio to over ten thousand titles and enhancing monetization through an improved ad-placement system, positioning mini-dramas as a potential growth driver for advertising revenue in 2025. Mr. Jun Wang, Chief Financial Officer, highlighted the focus on discipline and efficiency, which supported sequential operating profit growth and set a positive tone for the year ahead.
- Detailed Revenue and Cost Analysis for Fourth Quarter 2024: Revenue breakdowns for the fourth quarter revealed a 15% decline in membership services to RMB 4.10 billion (USD 562.1 million), a 13% drop in online advertising to RMB 1.43 billion (USD 196.4 million), a 20% decrease in content distribution to RMB 406.6 million (USD 55.7 million), and a 10% reduction in other revenues to RMB 670.2 million (USD 91.8 million), primarily due to a lighter content slate and reduced barter transactions. Cost of revenues decreased 10% to RMB 4.99 billion (USD 684.2 million), with content costs dropping 9% to RMB 3.44 billion (USD 471.7 million) due to strategic content adjustments, while selling, general, and administrative expenses fell 7% to RMB 882.5 million (USD 120.9 million), and research and development expenses remained stable at RMB 451.4 million (USD 61.8 million).
- Fiscal Year 2024 Revenue and Expenditure Breakdown: For the full year, membership services revenue decreased 13% to RMB 17.76 billion (USD 2.43 billion), online advertising revenue dropped 8% to RMB 5.71 billion (USD 782.8 million), while content distribution revenue grew 16% to RMB 2.85 billion (USD 390.0 million) due to increased barter transactions, and other revenues rose 1% to RMB 2.90 billion (USD 397.5 million). Cost of revenues declined 5% to RMB 21.95 billion (USD 3.01 billion), with content costs at RMB 15.71 billion (USD 2.15 billion), down 5%, reflecting a lighter content slate, while selling, general, and administrative expenses decreased 8% to RMB 3.68 billion (USD 504.4 million), and research and development expenses increased 1% to RMB 1.78 billion (USD 243.6 million).
- Financial Position and Cash Flow Summary: As of December 31, 2024, iQIYI maintained cash, cash equivalents, restricted cash, short-term investments, and long-term restricted cash totaling RMB 4.53 billion (USD 620.9 million), despite PAG drawing down the full USD 522.5 million loan facility, waiving the repurchase right for corresponding convertible senior notes due January 2028. Net cash provided by operating activities for the fourth quarter was RMB 519.0 million (USD 71.1 million), down from RMB 633.6 million, with free cash flow at RMB 498.1 million (USD 68.2 million) compared to RMB 614.4 million, while for the full year, operating cash flow was RMB 2.11 billion (USD 289.1 million) and free cash flow was RMB 2.03 billion (USD 278.2 million), down from RMB 3.35 billion and RMB 3.31 billion, respectively, indicating a cautious approach to liquidity management.
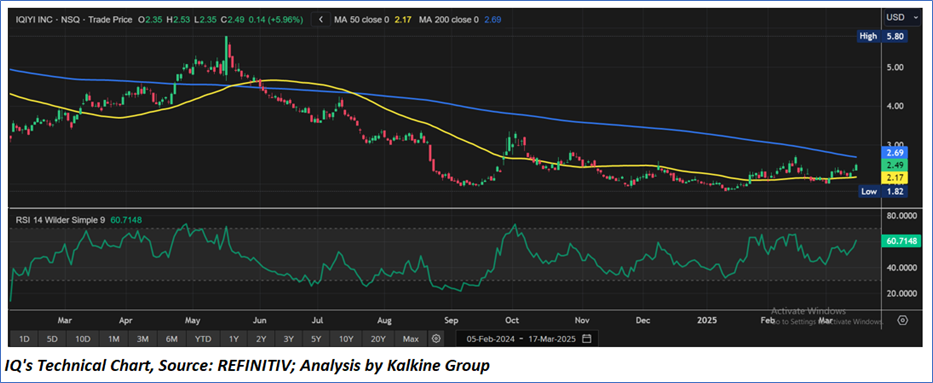
Technical Observation (on the daily chart):
The 14-day Relative Strength Index (RSI) is currently at 60.71 and above the midpoint, indicating an upside momentum, which could set the stage for further rally towards the upside. In addition, the current price is between both the 50-day and 200-day Simple Moving Averages (SMAs), which may work as medium to long term support and resistance levels respectively. The stock has taken decent support from the important levels of USD 2.30-USD 2.50, if the price sustains above, can lead to further upward momentum.
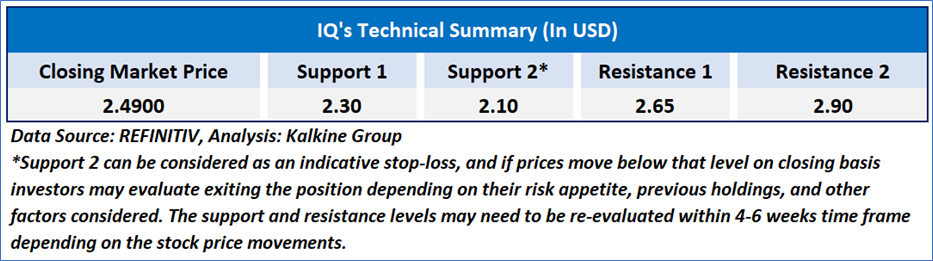
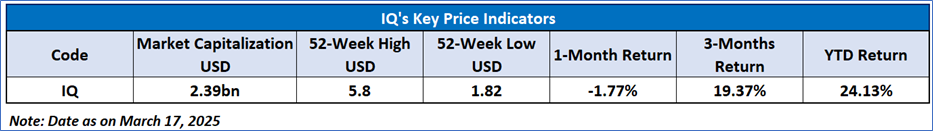
As per the above-mentioned price action, recent key business and financial updates, momentum in the stock over the last month, and technical indicators analysis, a ‘Buy’ rating has been given to iQIYI, Inc (NASDAQ: IQ) at the closing market price of USD 2.49, as of March 17, 2025.
Individuals can evaluate the stock based on the support and resistance levels provided in the report in case of keen interest taking into consideration the risk-reward scenario.
Markets are trading in a highly volatile zone currently due to certain macro-economic issues and prevailing geopolitical tensions. Therefore, it is prudent to follow a cautious approach while investing.
Related Risk: This report may be looked at from a high-risk perspective and a recommendation is provided for a short duration. This report is solely based on technical parameters, and the fundamental performance of the stocks has not been considered in the decision-making process. Other factors which could impact the stock prices include market risks, regulatory risks, interest rates risks, currency risks, social and political instability risks etc.
Note 1: Past performance is not a reliable indicator of future performance.
Note 2: The reference date for all price data, currency, technical indicators, support, and resistance level is March 17, 2025. The reference data in this report has been partly sourced from REFINITIV.
Note 3: Investment decisions should be made depending on an individual's appetite for upside potential, risks, holding duration, and any previous holdings. An 'Exit' from the stock can be considered if the Target Price mentioned as per the Valuation and or the technical levels provided has been achieved and is subject to the factors discussed above.
Note 4: Target Price refers to a price level that the stock is expected to reach as per the relative valuation method and or technical analysis taking into consideration both short-term and long-term scenarios.
Note 5: ‘Kalkine reports are prepared based on the stock prices captured either from the New York Stock Exchange (NYSE), NASDAQ Capital Markets (NASDAQ), and or REFINITIV. Typically, all sources (NYSE, NASDAQ, or REFINITIV) may reflect stock prices with a delay which could be a lag of 15-20 minutes. There can be no assurance that future results or events will be consistent with the information provided in the report. The information is subject to change without any prior notice.
 AU
AU
 Please wait processing your request...