FuelCell Energy, Inc.
FuelCell Energy, Inc. (NASDAQ: FCEL) provides environmentally sustainable energy solutions through its fuel cell technology. The company is a global producer of stationary fuel cell and electrolysis systems that help decarbonize power and generate hydrogen. Its technology produces electricity, heat, hydrogen, and water, while capturing and utilizing or sequestering carbon. The product range is built around two electrochemical platforms: carbonate and solid oxide.
Recent Business and Financial Updates
- Comparison of Revenues and Costs for the Three Months Ended July 31, 2024 and 2023
For the three months ended July 31, 2024, the company's total revenues amounted to USD 23.7 million, reflecting a decrease of USD 1.8 million, or 7%, compared to USD 25.5 million in the same period of the previous year. The cost of revenues for the period was USD 29.9 million, which represents an 11% decline from USD 33.7 million in the prior year. The decrease in both revenues and costs resulted in a reduced gross loss of USD 6.2 million for the quarter, an improvement of 25% from the USD 8.2 million loss reported in the same period in 2023. Gross margin for the period also improved, standing at -26.2%, up from -32.2% in the prior year.
- Product Revenues and Costs
Product revenues for the three months ended July 31, 2024, were USD 0.3 million, with no product revenues recorded in the same period the previous year. These revenues were generated under a new sales contract with Ameresco, Inc., for the provision of a 2.8 MW platform to the Sacramento Sewer District. However, the cost of product revenues increased by 44%, amounting to USD 4.2 million compared to USD 2.9 million in the prior year. The rise in costs was primarily due to manufacturing variances, including production volumes and unabsorbed overhead costs. As a result, the gross loss from product revenues grew by 35%, and the gross margin was significantly negative at -1572.4%.
- Service Agreements Revenues and Costs
Service agreements revenues saw a significant decline of 86%, falling to USD 1.4 million in the three months ended July 31, 2024, compared to USD 9.8 million in the same period in 2023. This drop was mainly due to the absence of module exchanges during the quarter, unlike the prior year, which saw two new module exchanges. Correspondingly, the cost of service agreement revenues decreased by 88%, amounting to USD 1.1 million in 2024, from USD 9.6 million in 2023. The gross profit from service agreements remained largely unchanged at USD 0.3 million, with a notable improvement in gross margin, which rose to 18.8% in 2024 from 2.7% in the previous year. This was due to the absence of a reserve for obsolete inventory, unlike in the prior year.
- Generation Revenues and Costs
Generation revenues for the three months ended July 31, 2024, amounted to USD 13.4 million, a 22% increase from the USD 11.0 million recorded in the previous year. This increase was driven by new operational projects such as the Toyota Project and the Derby Fuel Cell Projects. However, the cost of generation revenues also rose by 7%, totaling USD 18.8 million in 2024 compared to USD 17.5 million in 2023. This increase was mainly due to the larger installed fleet and additional operational projects. The gross loss from generation revenues decreased by 18%, reflecting a reduced loss of USD 5.4 million in 2024 compared to USD 6.5 million in 2023. Despite the higher costs, the gross margin improved significantly, from -59.2% in 2023 to -40.0% in 2024.
- Advanced Technologies Contract Revenues and Costs
Revenues from Advanced Technologies contracts surged by 84%, reaching USD 8.6 million in the three months ended July 31, 2024, compared to USD 4.7 million in the prior year. This increase was largely due to contracts with ExxonMobil Technology and Engineering Company (EMTEC) and other related projects. Correspondingly, the cost of these contracts also grew, rising by 55% to USD 5.8 million. As a result, the gross profit from these contracts more than tripled to USD 2.8 million, up from USD 0.9 million in the same period in 2023. The gross margin for Advanced Technologies contracts improved significantly, increasing from 19.8% in 2023 to 32.7% in 2024, driven by higher revenues and more efficient cost management.
- Net Loss and Noncontrolling Interests Summary
For the three months ended July 31, 2024, the company reported net losses attributable to noncontrolling interests, totaling USD (0.2) million for the Groton Project, USD (0.4) million for the LIPA Yaphank Project, and USD (1.8) million for the Derby Projects. These losses primarily stemmed from accelerated depreciation under the hypothetical liquidation at book value method. Net loss attributable to common stockholders was USD 33.5 million, compared to USD 25.1 million in the previous year, mainly due to the lack of a gain on extinguishment of finance obligations, partially offset by a decrease in operational loss and noncontrolling interest impact. The net loss per share was USD 0.07, reflecting an increase from USD 0.06 in 2023, driven by a higher number of outstanding shares.
- Operating Portfolio Growth
The company plans to expand its generation operating portfolio by developing turn-key fuel cell projects, requiring significant liquidity. This may involve using working capital, raising funds through equity or debt, or securing financing. While projects are expected to contribute long-term cash flow, delays or issues could impact liquidity. The portfolio totalled 62.8 MW as of July 31, 2024.
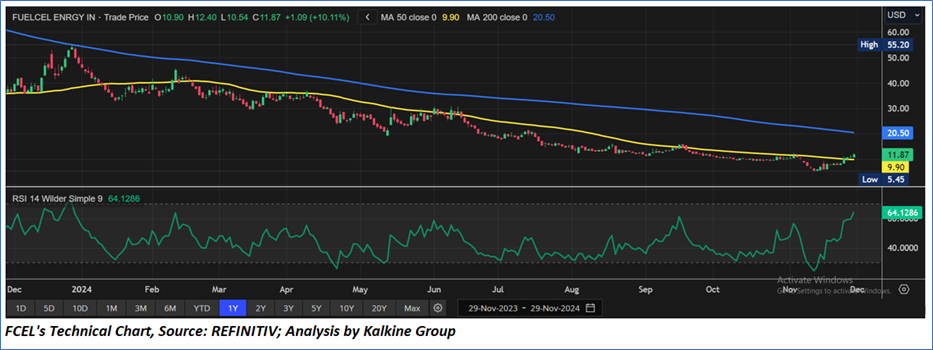
Technical Observation (on the daily chart):
FCEL's stock price has shown resilience around lower levels and experienced a notable increase recently. However, at the current levels, the price is hovering near a trendline resistance. A breakout to the upside could lead to larger targets, while we may expect minor consolidation in the near term. The 14-day Relative Strength Index (RSI) is currently above the midpoint. Furthermore, the stock price is positioned above both its short-term and medium-term moving averages, which may provide support in the near term. Key support and resistance levels will serve as important points for potential trend reversals and continuations.
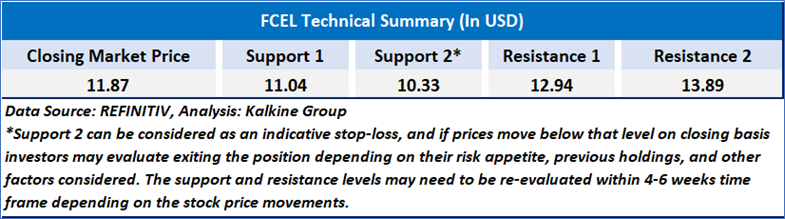
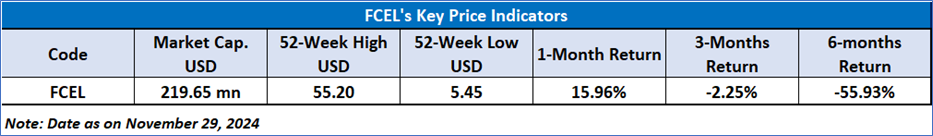
As per the above-mentioned price action, recent key business and financial updates, momentum in the stock over the last month, and technical indicators analysis, a ‘Watch’ rating has been given to FuelCell Energy, Inc. (NASDAQ: FCEL) at the closing market price of USD 11.87 as of November 29, 2024.
FuelCell Energy, Inc. (NASDAQ: FCEL)
Individuals can evaluate the stock based on the support and resistance levels provided in the report in case of keen interest taking into consideration the risk-reward scenario.
Markets are trading in a highly volatile zone currently due to certain macro-economic issues and prevailing geopolitical tensions. Therefore, it is prudent to follow a cautious approach while investing.
Related Risk: This report may be looked at from a high-risk perspective and a recommendation is provided for a short duration. This report is solely based on technical parameters, and the fundamental performance of the stocks has not been considered in the decision-making process. Other factors which could impact the stock prices include market risks, regulatory risks, interest rates risks, currency risks, social and political instability risks etc.
Note 1: Past performance is not a reliable indicator of future performance.
Note 2: The reference date for all price data, currency, technical indicators, support, and resistance level is November 29, 2024. The reference data in this report has been partly sourced from REFINITIV.
Note 3: Investment decisions should be made depending on an individual's appetite for upside potential, risks, holding duration, and any previous holdings. An 'Exit' from the stock can be considered if the Target Price mentioned as per the Valuation and or the technical levels provided has been achieved and is subject to the factors discussed above.
Note 4: Target Price refers to a price level that the stock is expected to reach as per the relative valuation method and or technical analysis taking into consideration both short-term and long-term scenarios.
Note 5: ‘Kalkine reports are prepared based on the stock prices captured either from the New York Stock Exchange (NYSE), NASDAQ Capital Markets (NASDAQ), and or REFINITIV. Typically, all sources (NYSE, NASDAQ, or REFINITIV) may reflect stock prices with a delay which could be a lag of 15-20 minutes. There can be no assurance that future results or events will be consistent with the information provided in the report. The information is subject to change without any prior notice.
 AU
AU

 Please wait processing your request...