Ondas Holdings Inc
Ondas Holdings Inc (NASDAQ: ONDS) operates as a technology company specializing in private wireless communications, autonomous drone systems, and automated data solutions through its subsidiaries, including Ondas Networks Inc., Ondas Autonomous Systems Inc. (OAS), Airobotics Ltd., and American Robotics, Inc. The company functions across two primary segments: Ondas Networks and OAS.
The Ondas Networks segment delivers wireless connectivity solutions designed to support mission-critical Industrial Internet applications. It develops, manufactures, and supports FullMAX, a patented Software Defined Radio (SDR) platform that enables secure, licensed, private wide-area broadband networks.
The OAS segment focuses on the development and integration of advanced drone-based platforms tailored for high-performance government and Tier-1 commercial applications. Its key commercial offerings include the Optimus System and the Iron Drone Raider. In addition, the company is expanding its capabilities in the manufacturing of precision optical components and related systems.

Recent Developments:
- German Deployment Highlights Rising Counter-Drone Demand: Ondas Holdings Inc. reported a notable milestone as its subsidiary, Sentrycs, successfully delivered and deployed its counter-UAS (C-UAS) solutions to a German State Police office. The deployment comes amid heightened concerns over drone activity in Germany, where more than 1,000 suspicious drone flights were reported in 2025 near military facilities, airports, and sensitive government zones. The announcement triggered a positive market reaction, with Ondas shares rising 9% following the news. Management emphasized that the deployment demonstrates the effectiveness of lawful, precise drone mitigation technologies, further strengthened by the launch of Sentrycs’ new portable solution, Scout, aimed at enhancing tactical mobility without sacrificing performance.
- Expansion of European Defense Contracts: Ondas continues to strengthen its European footprint through its subsidiary Airobotics, which secured a new multi-million-dollar order from a major NATO-country customer for its Iron Drone Raider counter-UAS system. This order forms part of a previously signed USD 16.8 million contract aimed at protecting two major European international airports and follows successful operational deployment at a leading airport. The latest award focuses on safeguarding critical infrastructure in complex civil environments, reinforcing Iron Drone Raider’s differentiated positioning in layered airspace defense.
- Large-Scale Demining Program in Israel: Further expanding its defense portfolio, Ondas’ subsidiary 4M Defense was awarded a multi-year demining contract in Israel valued at over USD 30 million after winning a competitive tender. The program covers approximately 741 acres of strategically sensitive terrain along the Israel-Syria border and represents one of the largest land-clearance initiatives undertaken in the country. With an execution period of up to three years and potential extensions, the contract enhances Ondas’ multi-domain defense capabilities while strengthening its presence in high-priority security markets.
Financial Performance Review for the quarter ended September 30, 2025 (Q3FY25)
- Revenue Acceleration and Market Demand Expansion: Ondas Holdings reported record revenue of USD 10.1 million in Q3 FY2025, compared to USD 1.5 million in Q3 FY2024, reflecting a 582% year-on-year increase. The sharp growth was primarily driven by sustained deliveries of Iron Drone Raider and Optimus autonomous systems under defense and public safety contracts, alongside incremental revenue contributions from newly acquired entities. The performance highlights accelerating demand for autonomous aerial and ground systems across global defense markets.
- Gross Profit and Margin Expansion: Gross profit improved significantly to USD 2.6 million in Q3 FY2025 from USD 0.05 million in Q3 FY2024. Correspondingly, gross margin expanded to 26% from 3% in the prior-year quarter. The improvement reflects higher production volumes, better cost absorption of fixed expenses, and operational leverage from scaling the OAS segment. However, management indicated that margins may fluctuate based on product mix and delivery timing.
- Operating Cost Structure and Investment Phase: Total operating expenses increased to USD 18.1 million in Q3 FY2025 compared to USD 8.7 million in Q3 FY2024. The rise was largely attributable to expansion of payroll to support scaling operations, professional fees linked to acquisition activities, infrastructure build-out, and approximately USD 5.0 million in non-cash stock-based compensation. The elevated expense base reflects a deliberate investment strategy aimed at supporting anticipated multi-year growth.
- Profitability and Bottom-Line Movement: Operating loss widened to USD 15.5 million in Q3 FY2025 from USD 8.7 million in Q3 FY2024 due to higher operating expenses. However, net loss improved to USD 7.5 million from USD 9.5 million in the prior-year quarter, supported by increased interest income from a strengthened cash position and unrealized gains on equity investments. The divergence between operating and net loss reflects improved financial income generation.
Balance Sheet And Capital Structure
- Transformational Liquidity Position: Cash and restricted cash increased to USD 433.4 million as of September 30, 2025, compared to USD 30.0 million as of December 31, 2024. On a pro forma basis, adjusted for subsequent equity raises, cash reached approximately USD 840.4 million. This capital infusion significantly enhances financial flexibility, supports acquisition-led growth, and reduces near-term liquidity risk.
- Debt Reduction and Equity Strengthening: Convertible debt at the holding-company level was fully eliminated during 2025, reducing total debt materially. Total stockholders’ equity increased to USD 487.2 million as of September 30, 2025, compared to USD 16.6 million at year-end 2024. The strengthened balance sheet positions the company to pursue strategic acquisitions and scale operations.
Operational Performance and Outlook
- Backlog Growth and Revenue Visibility: Consolidated backlog reached USD 23.3 million at the end of Q3 FY2025, compared to USD 10.0 million entering 2025. OAS backlog stood at USD 22.2 million, reflecting expanding program adoption across multiple defense markets. Management increased its FY2025 revenue target to at least USD 36 million, up from USD 25 million previously, and established a preliminary FY2026 revenue target of at least USD 110 million, indicating confidence in sustained demand momentum.
Key Risks:
- Execution and Integration Risk: Rapid expansion through multiple acquisitions (Sentrycs, 4M Defense, Apeiro and others) may create operational complexity, integration challenges, and potential delays in realizing expected synergies and profitability.
- Revenue Concentration and Contract Timing Risk: A significant portion of revenue is driven by large defense and government contracts, which are subject to procurement cycles, regulatory approvals, budget allocations, and potential delays or cancellations.
- Margin Volatility and Cost Escalation: Elevated operating expenses related to scaling operations, R&D, and talent acquisition could pressure margins if revenue growth moderates or project timelines shift.
- Geopolitical and Regulatory Exposure: Operations in defense-sensitive regions such as Europe and Israel expose the company to geopolitical instability, export controls, compliance requirements, and changes in defense policy or international regulations.
Technical Observation (on the daily chart):
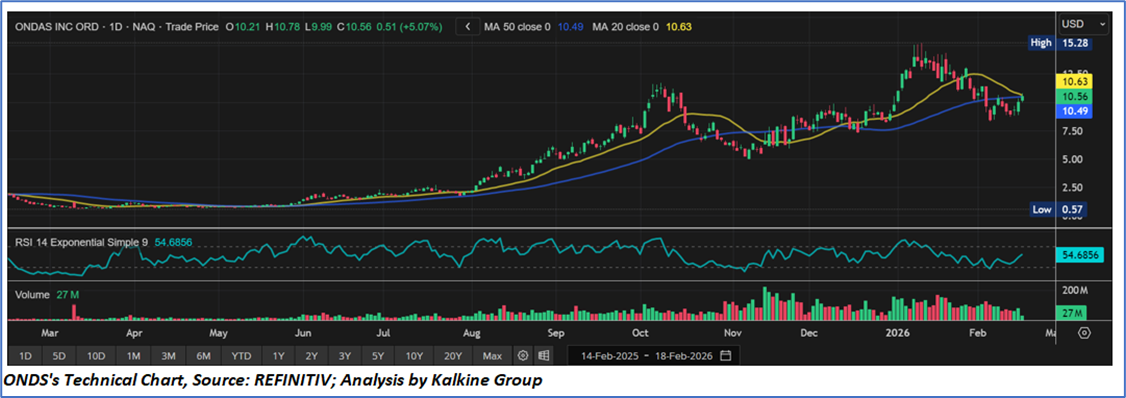
- The stock has exhibited a powerful medium-term uptrend, advancing from below USD 2 to a peak near USD 15.28. The chart structure reflects a consistent pattern of higher highs and higher lows, confirming sustained bullish momentum through late 2025 and early 2026. Despite the recent pullback, the broader price structure remains constructive and technically bullish.
- Following the sharp rally into the highs, the stock entered a corrective consolidation phase, retracing toward the USD 10–11 zone. The current price action around USD 10.50 suggests stabilization and potential base formation rather than a breakdown in trend. This consolidation appears to be a natural pause after an extended advance.
- The stock is currently trading near the 20-day moving average (USD 10.63) and slightly above the 50-day moving average (USD 10.49). The convergence of these averages indicates short-term equilibrium between buyers and sellers. Importantly, maintaining price above the 50-day moving average supports the continuation of the intermediate uptrend and reduces the probability of a deeper trend reversal.
- The 14-day RSI is positioned around 54–55, reflecting neutral to mildly bullish momentum. After declining during the correction, the RSI has started to trend upward, signaling improving buying interest. The indicator is not in overbought territory, suggesting there is room for further upside should positive momentum continue.
- Volume expanded significantly during the strong upward rally, reflecting broad participation and accumulation. During the pullback phase, volume moderated rather than spiking sharply, indicating limited signs of aggressive distribution. The recent stabilization phase is supported by steady trading activity, which is generally constructive for potential trend continuation.
Ondas Holdings is positioned at the intersection of rapidly expanding autonomous defense and counter-UAS markets, supported by record revenue growth, expanding backlog visibility, and a significantly strengthened balance sheet. The company’s strategic acquisition program, scalable operating platform, and strong liquidity provide a foundation for accelerated revenue expansion and future operating leverage, positioning it for meaningful long-term value creation as defense modernization trends continue globally.
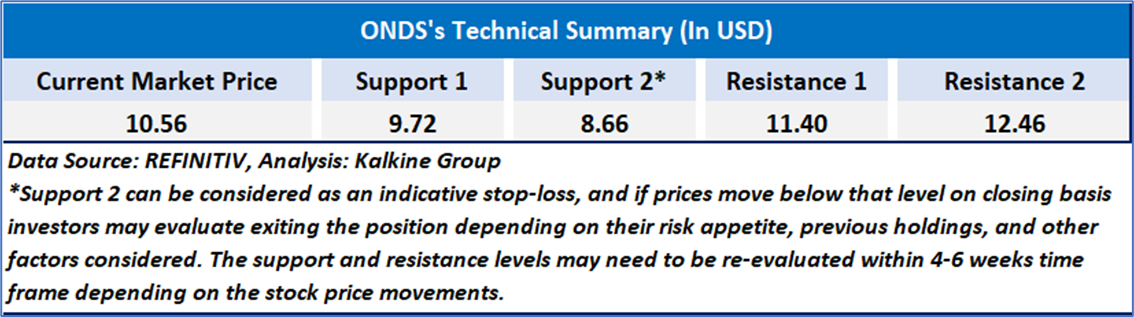
As per the above-mentioned price action, recent key business and financial updates, momentum in the stock over the last month, and technical indicators analysis, a ‘Speculative Buy’ rating has been given to Ondas Holdings Inc (NASDAQ: ONDS) at the current market price of USD 10.56, as of February 18,2026 at 7:44 am PST.

Individuals can evaluate the stock based on the support and resistance levels provided in the report in case of keen interest taking into consideration the risk-reward scenario.
Markets are trading in a highly volatile zone currently due to certain macro-economic issues and prevailing geopolitical tensions. Therefore, it is prudent to follow a cautious approach while investing.
Related Risk: This report may be looked at from a high-risk perspective and a recommendation is provided for a short duration. This report is solely based on technical parameters, and the fundamental performance of the stocks has not been considered in the decision-making process. Other factors which could impact the stock prices include market risks, regulatory risks, interest rates risks, currency risks, social and political instability risks etc.
Note 1: Past performance is not a reliable indicator of future performance.
Note 2: The reference date for all price data, currency, technical indicators, support, and resistance level is February 18,2026. The reference data in this report has been partly sourced from REFINITIV.
Note 3: Investment decisions should be made depending on an individual's appetite for upside potential, risks, holding duration, and any previous holdings. An 'Exit' from the stock can be considered if the Target Price mentioned as per the Valuation and or the technical levels provided has been achieved and is subject to the factors discussed above.
Note 4: Target Price refers to a price level that the stock is expected to reach as per the relative valuation method and or technical analysis taking into consideration both short-term and long-term scenarios.
Note 5: ‘Kalkine reports are prepared based on the stock prices captured either from the New York Stock Exchange (NYSE), NASDAQ Capital Markets (NASDAQ), and or REFINITIV. Typically, all sources (NYSE, NASDAQ, or REFINITIV) may reflect stock prices with a delay which could be a lag of 15-20 minutes. There can be no assurance that future results or events will be consistent with the information provided in the report. The information is subject to change without any prior notice.

 CA
 NZ
 UK
 US
 IND

 AU

 Please wait processing your request...