Puma Biotechnology Inc
Puma Biotechnology Inc (NASDAQ: PBYI) is a biopharmaceutical company dedicated to developing and commercializing innovative products aimed at improving cancer treatment. Its flagship product, NERLYNX, is an oral formulation of neratinib designed for the treatment of HER2-positive breast cancer.
Recent Business and Financial Updates
- Revenue Growth and Product Performance: Puma Biotechnology, Inc. reported product revenue, net from sales of its first commercial product, NERLYNX, totaling $56.1 million for Q3 2024, an increase from $51.6 million in Q3 2023. For the first nine months of 2024, product revenue, net amounted to $140.8 million, compared to $149.9 million during the same period in 2023.
- GAAP and Non-GAAP Net Income: Under GAAP, Puma recorded net income of $20.3 million, or $0.41 per basic and diluted share, for Q3 2024, compared to $5.8 million, or $0.12 per basic and diluted share, in Q3 2023. For the first nine months of 2024, net income was $11.0 million, or $0.23 per basic share and $0.22 per diluted share, compared to $9.3 million, or $0.20 per basic and diluted share, in the same period of 2023. Non-GAAP adjusted net income, which excludes stock-based compensation expenses, was $22.4 million, or $0.46 per basic share and $0.45 per diluted share, for Q3 2024, compared to $8.3 million, or $0.18 per basic share and $0.17 per diluted share, in Q3 2023.
- Cash Flow and Financial Position: Net cash provided by operating activities was $11.0 million in Q3 2024, compared to $10.7 million in Q3 2023. For the first nine months of 2024, Puma reported $23.3 million in net cash from operating activities, up from $16.6 million in the same period of 2023. The company’s cash, cash equivalents, and marketable securities were approximately $97 million as of September 30, 2024, compared to $96 million at December 31, 2023.
- Key Clinical Developments: Puma is advancing clinical trials for alisertib, targeting extensive-stage small cell lung cancer and chemotherapy-naïve HER2-negative, hormone receptor-positive metastatic breast cancer. Upcoming milestones include the initiation of a Phase II trial for alisertib in combination with endocrine treatment (Q4 2024) and the presentation of interim data from ongoing trials in 2025.
- Revenue Composition and Growth Drivers: Total revenue for Q3 2024 was $80.5 million, including $56.1 million in product revenue, net, and $24.4 million in royalty revenue. This marks a significant increase from total revenue of $56.1 million in Q3 2023, which included $51.6 million in product revenue, net, and $4.5 million in royalty revenue. For the first nine months of 2024, total revenue reached $171.4 million, an increase from $163.5 million in the same period of 2023.
- Operating Costs and Expenses: Operating costs and expenses rose to $58.4 million in Q3 2024 from $47.5 million in Q3 2023. For the first nine months of 2024, operating expenses were $153.8 million, up from $145.7 million in 2023. This increase was driven by higher cost of sales, primarily related to royalty expenses from sales in China and increased shipments to the region.
- Reduced SG&A Expenses: Selling, general, and administrative (SG&A) expenses decreased to $16.8 million in Q3 2024 from $22.8 million in Q3 2023. For the first nine months of 2024, SG&A expenses were $63.5 million, down from $69.7 million in the same period of 2023. This decrease reflects lower headcount and reduced marketing expenses, offset by increased legal fees and annual salary adjustments.
- Increased Research and Development Spending: Research and development (R&D) expenses were $12.5 million in Q3 2024, up from $11.4 million in Q3 2023. For the first nine months of 2024, R&D expenses rose to $39.8 million from $37.6 million in 2023. The increase was attributed to higher clinical trial expenses, particularly related to alisertib studies and associated drug procurement.
- Revised 2024 Financial Outlook: Puma updated its 2024 financial outlook, raising full-year net product revenue guidance to $187–$190 million, compared to the previous range of $183–$190 million. Royalty revenue is now expected to be $34–$36 million, up from $30–$34 million. Full-year net income is projected at $15–$17 million, an increase from the prior estimate of $12–$15 million.
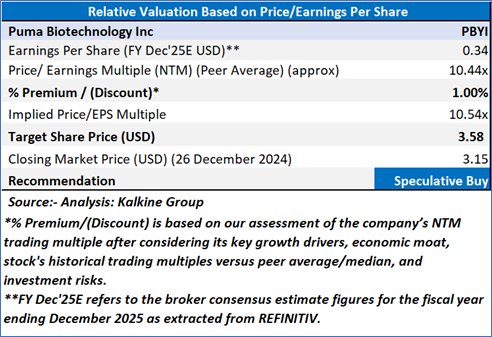
Valuation Methodology (using P/E Approach)
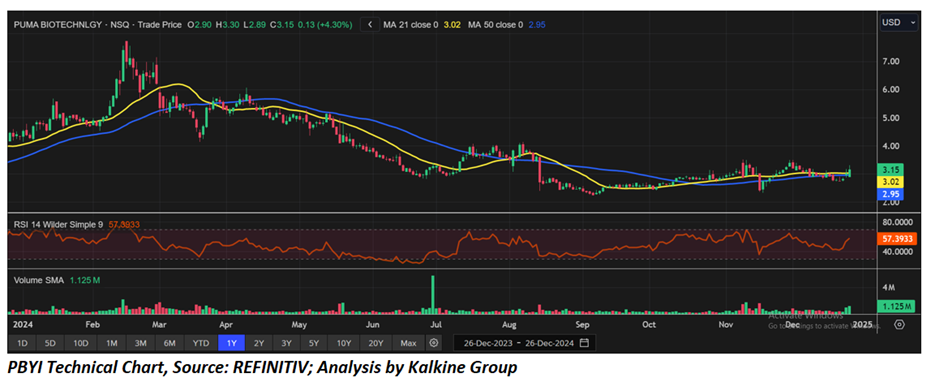
Technical Observation (on the daily chart):
PBYI's stock in short-term bullish trend as stock traded above its crucial support levels of 21-D and 50-D Exponential Moving Averages (EMAs). Further, the leading momentum indicators 14-D Relative Strength Index (RSI) settled at 57.39 at the last closing price, which implies a bullish bias in the stock. However, the long-term trend in the stock is still bearish as the stock traded below its crucial long-term resistance level of 200-D EMA and tried to break 200-D EMA resistance for 3 times since November 08, 2024, indicates 200-D EMA acting as a strong resistance in the stock. However, Moving Average Convergence Divergence (MACD) at the verge of registering a crossover of 9-D EMA line, with spread between 12-D EMA and 26-D EMA is positive, a bullish signal.
Puma Biotechnology reported strong Q3 2024 financial results, with a 9% increase in NERLYNX® sales revenue and total revenue reaching $80.5 million. Net income rose significantly, supported by reduced SG&A expenses and improved operating cash flow. Advancements in alisertib clinical trials and an upward revision of 2024 revenue and income guidance highlight the company’s progress in enhancing cancer care and achieving robust financial and operational performance.
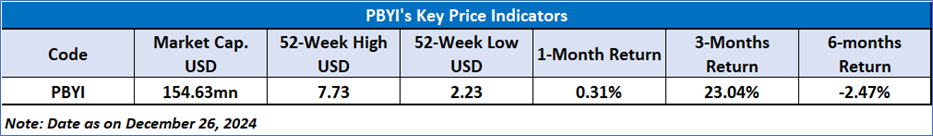
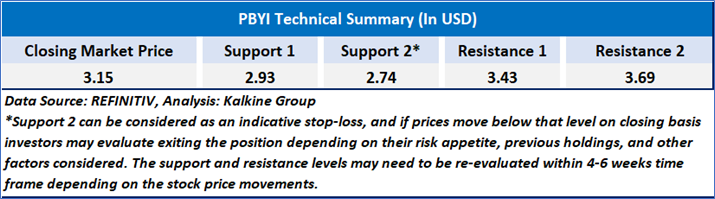
As per the above-mentioned price action, recent key business and financial updates, and technical indicators analysis, a ‘Speculative Buy’ rating has been given to Puma Biotechnology Inc (NASDAQ: PBYI) at the closing market price of USD 3.15 as of December 26,2024.
Individuals can evaluate the stock based on the support and resistance levels provided in the report in case of keen interest taking into consideration the risk-reward scenario.
Markets are trading in a highly volatile zone currently due to certain macro-economic issues and prevailing geopolitical tensions. Therefore, it is prudent to follow a cautious approach while investing.
Related Risk: This report may be looked at from a high-risk perspective and a recommendation is provided for a short duration. This report is solely based on technical parameters, and the fundamental performance of the stocks has not been considered in the decision-making process. Other factors which could impact the stock prices include market risks, regulatory risks, interest rates risks, currency risks, social and political instability risks etc.
Note 1: Past performance is not a reliable indicator of future performance.
Note 2: The reference date for all price data, currency, technical indicators, support, and resistance level is December 26,2024. The reference data in this report has been partly sourced from REFINITIV.
Note 3: Investment decisions should be made depending on an individual's appetite for upside potential, risks, holding duration, and any previous holdings. An 'Exit' from the stock can be considered if the Target Price mentioned as per the Valuation and or the technical levels provided has been achieved and is subject to the factors discussed above.
Note 4: Target Price refers to a price level that the stock is expected to reach as per the relative valuation method and or technical analysis taking into consideration both short-term and long-term scenarios.
Note 5: ‘Kalkine reports are prepared based on the stock prices captured either from the New York Stock Exchange (NYSE), NASDAQ Capital Markets (NASDAQ), and or REFINITIV. Typically, all sources (NYSE, NASDAQ, or REFINITIV) may reflect stock prices with a delay which could be a lag of 15-20 minutes. There can be no assurance that future results or events will be consistent with the information provided in the report. The information is subject to change without any prior notice.
 AU
AU

 Please wait processing your request...