This report is an updated version of the report published on 15 December 2023 at 4:30 PM AEDT.
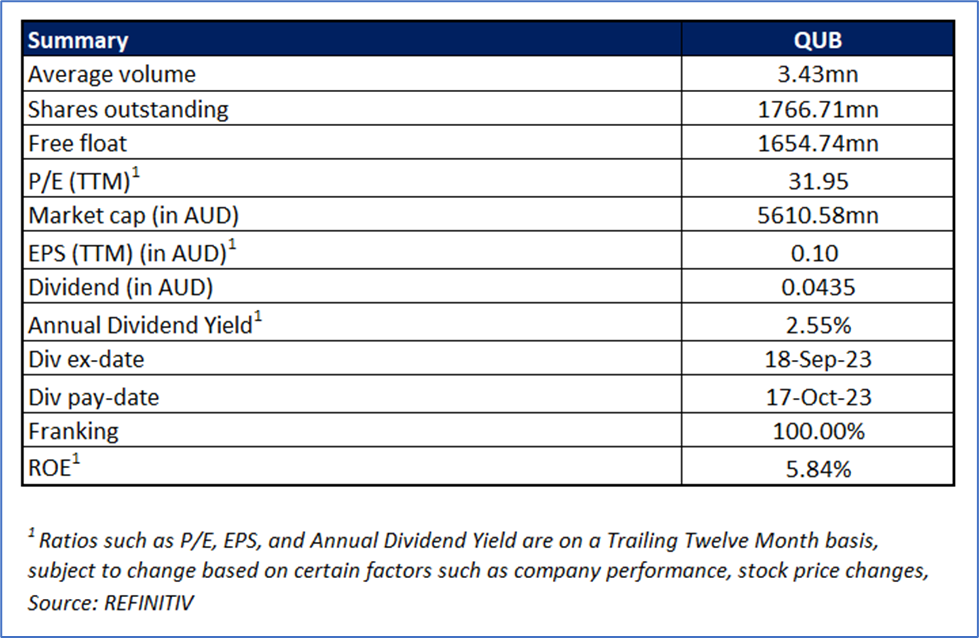
Qube Holdings Limited (ASX: QUB) is involved in providing solutions for handling containers, bulk, automotive and general cargo.
Recommendation Rationale – SELL at AUD 3.175
- Profit Booking: QUB breached resistance 1 level recommended in the previous coverage on 13 November 2023; thus, it is offering a profit booking opportunity.
- Technical Indicator: The momentum oscillator 14-Day RSI (~78.84) is approaching the overbought zone; and thus, price can face correction in the short term.
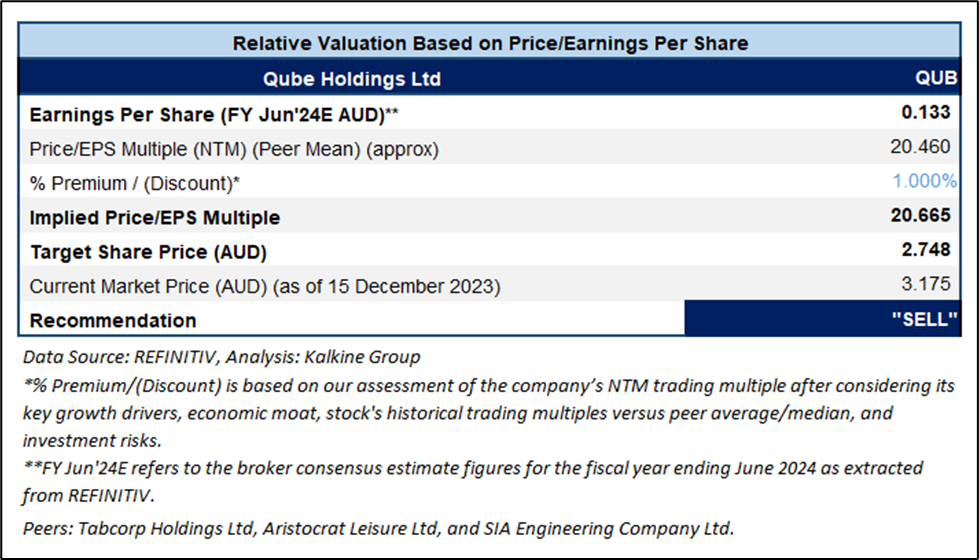
- Overvalued Multiples: On a forward 12-month basis – key valuation multiples (Price/Earnings, EV/EBITDA, EV/Sales, and Price/Cash Flow) are higher than median of Industrials’ sector.
- Financials: During FY23, revenue and EBITDA witnessed a jump of 16.2% and 26.8%, respectively.
QUB Daily Chart
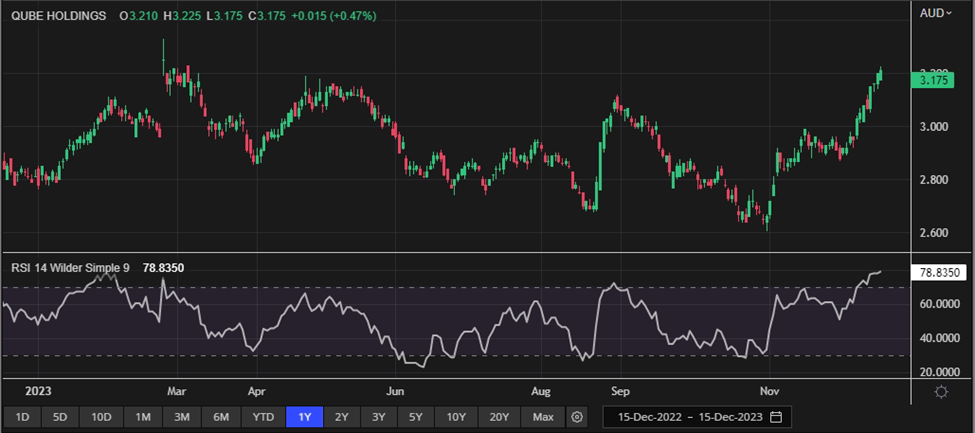
Daily Technical Chart; Source: REFINITIV
Valuation Methodology: Price/Earnings Approach (FY24E) (Illustrative)
Considering that the stock has crossed its R1 level, and the 14-day RSI is showing a reading of ~78.84, close to the overbought zone, QUB may face resistance before crossing its R2. Given its current trading levels, recent rally in the share price, and risks associated, it is prudent to book profit at the current levels. Hence, a ‘Sell’ recommendation is given on the stock at the current market price of AUD 3.175, at 3:15 PM AEDT, as of 15 December 2023.
Note: This report may be updated with details around fundamental and technical analysis, price/ chart in due course, as appropriate.
Note 1: Past performance is neither an indicator nor a guarantee of future performance.
Note 2: The reference date for all price data, currency, technical indicators, support, and resistance levels is 19 December 2023. The reference data in this report has been partly sourced from REFINITIV.
Note 3: Investment decisions should be made depending on an individual's appetite for upside potential, risks, holding duration, and any previous holdings. An 'Exit' from the stock can be considered if the Target Price mentioned as per the Valuation and or the technical levels provided has been achieved and is subject to the factors discussed above.
Technical Indicators Defined: -
Support: A level at which the stock prices tend to find support if they are falling, and downtrend may take a pause backed by demand or buying interest.
Resistance: A level at which the stock prices tend to find resistance when they are rising, and uptrend may take a pause due to profit booking or selling interest.
Stop-loss: In general, it is a level to protect further losses in case of any unfavourable movement in the stock prices.
 AU
AU

 Please wait processing your request...