This report is an updated version of the report published on 30 July 2025 at 11:58 AM AEST.
CSL Limited (ASX: CSL)
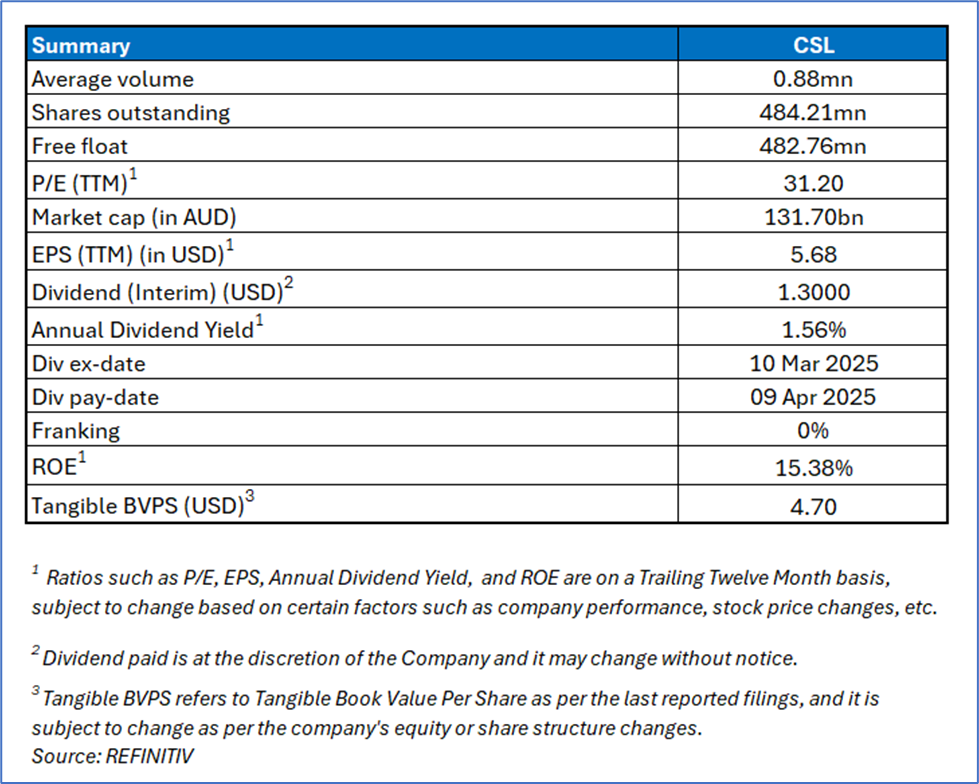
CSL Limited (ASX: CSL) is engaged in the research, development, manufacturing, marketing and distribution of biopharmaceutical products and vaccines. The ASX-listed biotechnology company includes three businesses, CSL Behring, CSL Seqirus and CSL Vifor. The company delivers innovative life-saving medicines in over 100 countries.
Recommendation Rationale – SELL at AUD 275.790
- Technical Standpoint: CSL share price has surpassed the R1 level recommended on 21 July 2025, while 14-day RSI (~75.56) is in the overbought zone. Therefore, it can face resistance at the current levels.
- Seqirus Weakness and Revenue Decline: The Seqirus vaccines division was negatively impacted by significantly low influenza immunisation rates, particularly in the United States. Total Seqirus revenue fell 9% in H1 FY25 compared to the prior period, with major products like FLUAD and FLUCELVAX recording declines of 17% and 12% respectively.
- Cost Pressures – Rising Expenses: General and Administrative (G&A) expenses jumped 27% YoY in H1 FY25, attributed to the timing of non-recurring project costs, with normalization only expected in the second half. Such a significant cost increase, even if temporary, erodes near-term margins and signals potential internal operational challenges.
- Ongoing Competitive and Regulatory Risks: The outlook section (including key variables that may affect full-year guidance) lists numerous risks such as regulatory approvals, pricing/reimbursement changes, competitive developments, manufacturing challenges, and legislative factors. If realized, these risks may materially impact earnings and growth.
- Overvalued Multiples: On a forward 12-month basis – key trading multiples (EV/Sales, EV/EBITDA, Price/Earnings, and Price/Cash Flow) are trading higher than median of the Healthcare sector.
CSL Daily Chart
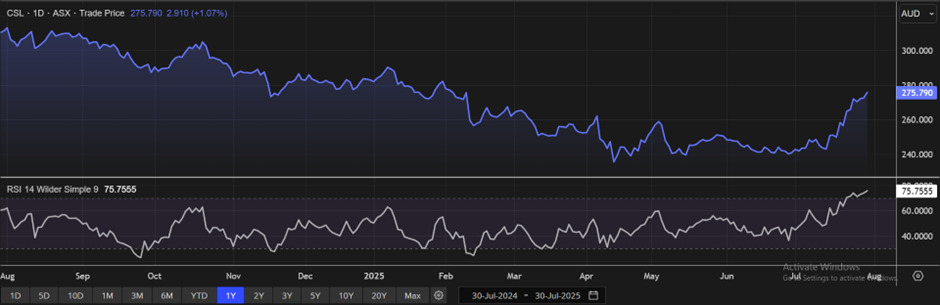
(Source: REFINITIV; Analysis by Kalkine Group)
Valuation Methodology: Price/Earnings Approach (FY Jun'26E) (Illustrative)
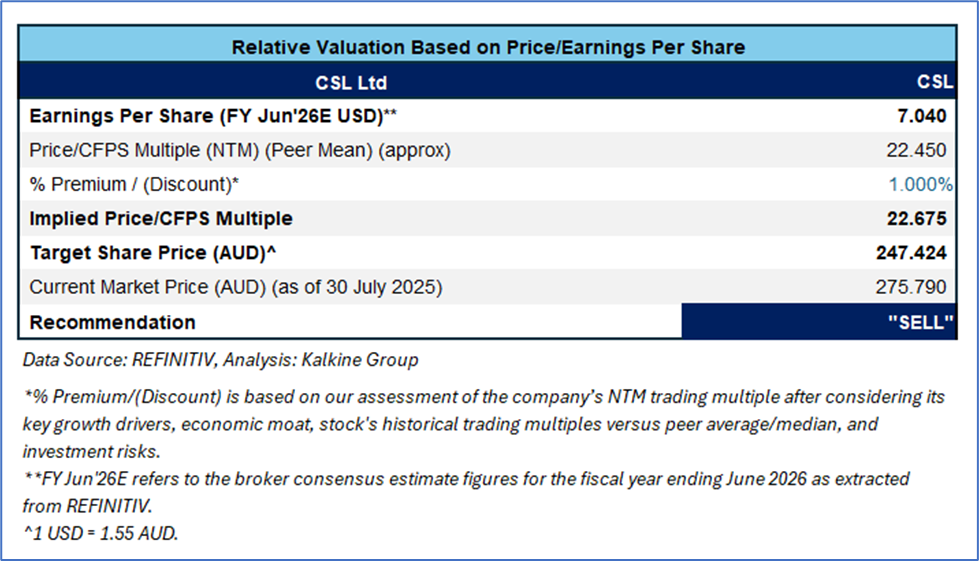
CSL can trade at a slight premium than peers considering critical healthcare segments, including plasma therapies and vaccines, markets that are less sensitive to economic downturns; global leadership position in plasma therapies and maintains pricing power in niche markets.
Given its current trading levels, recent rally in the share price, and risks associated, it is prudent to sell the stock at the current levels. Hence, a ‘Sell’ recommendation is given on the stock at the current market price of AUD 275.790, as of 30 July 2025 at 11:20 AM AEST.
Markets are trading in a highly volatile zone currently due to certain macro-economic issues and geopolitical issues prevailing geopolitical tensions. Therefore, it is prudent to follow a cautious approach while investing.
Note 1: Past performance is neither an indicator nor a guarantee of future performance.
Note 2: The reference date for all price data, currency, technical indicators, support, and resistance levels is 30 July 2025. The reference data in this report has been partly sourced from REFINITIV.
Note 3: Investment decisions should be made depending on an individual's appetite for upside potential, risks, holding duration, and any previous holdings. An 'Exit' from the stock can be considered if the Target Price mentioned as per the Valuation and or the technical levels provided has been achieved and is subject to the factors discussed above.
Note 4: Kalkine reports are prepared based on the stock prices captured either from REFINITIV or Trading View. Typically, REFINITIV or Trading View may reflect stock prices with a delay which could be a lag of 25-30 minutes. There can be no assurance that future results or events will be consistent with the information provided in the report. The information is subject to change without any prior notice.
Note 5: Dividend Yield may vary as per the stock price movement.
Technical Indicators Defined: -
Support: A level at which the stock prices tend to find support if they are falling, and downtrend may take a pause backed by demand or buying interest.
Resistance: A level at which the stock prices tend to find resistance when they are rising, and uptrend may take a pause due to profit booking or selling interest.
Stop-loss: In general, it is a level to protect further losses in case of any unfavourable movement in the stock prices.
 AU
AU

 Please wait processing your request...