Kalkine has a fully transformed New Avatar.

Grocery Outlet Holding Corp
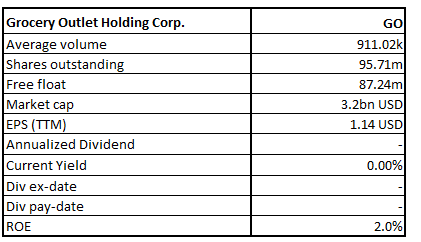
GO Details
Grocery Outlet Holding Corp (NASDAQ: GO) is engaged in the retailing business with a high-growth, extreme value retailer in terms of quality. The company is engaged in selling name-brand consumables and fresh products through a combination of independently owned and operated stores.
Q1FY21 Results Performance (For the Period Ended April 3, 2021)
The company has registered a 1% YoY decline in net sales to $752.5 million, primarily on account of 8.2% reduction recorded in comparable store sales during the quarter as against a growth of 17.4% recorded in the same period last year. Due to the higher cost of sales in terms of percentage, the period witnessed a moderate decline in its gross margin to 30.8% from 31.2% in the same period in fiscal 2020. Adjusted EBITDA for the quarter decreased by 13.7% YoY to $48.8 million. Notably, the company posted significant growth in its net income by 49.4% to $18.9 million and its diluted earnings per share increased to $0.19 from $0.13 in the PCP.
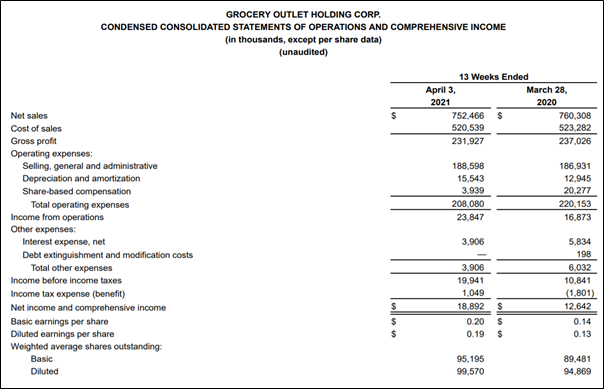
Financial Highlights (Source: Company Reports)
Outlook
Driven by its deep value orientation along with its strong customer and supplier relationships, and substantial prevailing whitespace opportunity, the company is better placed for long-term growth. The company has guided of opening around 36 to 38 stores in 2021 with one closure of the store in FY21. Capital expenditures, net of tenant improvement allowances is estimated to be around $130.0 million for FY21. Besides, it remains focused on the sustained expansion of its footprint through augmenting its store base by 10% each year while constantly reinvesting in its business. In a move to augment its domestic presence, the company recently has opened its 400th store at the newest location in Hailey, Idaho. Meanwhile, its FY21 results will reflect the performance for 52 weeks as against the performance of 53 weeks in FY20.
Key Risks
Volatility in interest rate will impact its credit facilities, which bear variable interest rates. The pandemic outbreaks could disrupt and adversely affect its business as well as its operations and financial condition. Further, intense competition in the retail food industry along with the shift in consumer trends toward private labels from name-brand products pose greater concerns. The comparable store sales in Q2FY21 are still in the negative low double digits.
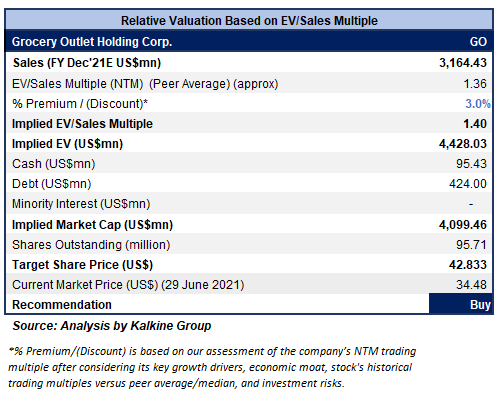
Valuation Methodology: EV/Sales Based Relative Valuation (Illustrative)
Technical Overview:
Weekly Chart –

Source: REFINITIV
Note: Purple colour lines are Bollinger Bands® with the upper band suggesting overbought status while the lower band oversold status, and yellow lines are Fibonacci retracement lines which measure price rebound and backtrack. https://www.bollingerbands.com/
While remaining in a downtrend, the stock has been trying to retrace up in a gradual manner. However, for the ongoing week, it has given a softer close at $34.48, erasing all the gains it made in the previous week. The technical indicator RSI with a reading around 42 suggests neutral momentum for the stock.
Going forward, the stock may have resistance around 20 periods SMA of $36.70 whereas support could be around $33.00.
Stock Recommendation
We have applied EV/Sales multiple based relative valuation (on an illustrative basis) and the target price reflects a rise of low double-digit (in % terms). We have applied a slight premium as compared to peer average EV/Sales multiple (NTM basis) considering its sustained focus on store expansion as well as substantial prevailing whitespace opportunity, strong consumer engagement, and solid business performance in FY20. For the purposes of relative valuation, we have taken peers like Sprouts Farmers Market Inc (SFM.OQ), BJ's Wholesale Club Holdings Inc (BJ.N), to name a few.
Considering the aforementioned factors along with its healthy liquidity position and expansion growth strategies, we give a “Buy” recommendation on the stock at the current market price of $34.48 per share, down by 0.92% on 29th June 2021.
Note 1: The reference data in this report has been partly sourced from REFINITIV.
Note 2: Investment decisions should be made depending on the investors’ appetite on upside potential, risks, holding duration, and any previous holdings. Investors can consider exiting from the stock if the Target Price mentioned as per the analysis has been achieved and subject to the factors discussed above alongside support levels provided.
Technical Indicators Defined:-
Support: A level where-in the stock prices tend to find support if they are falling, and downtrend may take a pause backed by demand or buying interest.
Resistance: A level where-in the stock prices tend to find resistance when they are rising, and uptrend may take a pause due to profit booking or selling interest.
Disclaimer - This report has been issued by Kalkine Pty Limited (ABN 34 154 808 312) (Australian financial services licence number 425376) (“Kalkine”) and prepared by Kalkine and its related bodies corporate authorised to provide general financial product advice. Kalkine.com.au and associated pages are published by Kalkine.
Any advice provided in this report is general advice only and does not take into account your objectives, financial situation or needs. You should therefore consider whether the advice is appropriate to your objectives, financial situation and needs before acting upon it.
There may be a Product Disclosure Statement, Information Statement or other offer document for the securities or other financial products referred to in Kalkine reports. You should obtain a copy of the relevant Product Disclosure Statement, Information Statement or offer document and consider the statement or document before making any decision about whether to acquire the security or product.
You should also seek advice from a financial adviser, stockbroker or other professional (including taxation and legal advice) as necessary before acting on any advice in this report or on the Kalkine website. Not all investments are appropriate for all people.
The information in this report and on the Kalkine website has been prepared from a wide variety of sources, which Kalkine, to the best of its knowledge and belief, considers accurate. Kalkine has made every effort to ensure the reliability of information contained in its reports, newsletters and websites. All information represents our views at the date of publication and may change without notice.
Kalkine does not guarantee the performance of, or returns on, any investment. To the extent permitted by law, Kalkine excludes all liability for any loss or damage arising from the use of this report, the Kalkine website and any information published on the Kalkine website (including any indirect or consequential loss, any data loss or data corruption). If the law prohibits this exclusion, Kalkine hereby limits its liability, to the extent permitted by law, to the resupply of services.
Please also read our Terms & Conditions and Financial Services Guide for further information.
On the date of publishing this report (referred to on the Kalkine website), employees and/or associates of Kalkine do not hold interests in any of the securities or other financial products covered on the Kalkine website.
 Please wait processing your request...