This report is an updated version of the report published on 20 February 2025 at 1:58 PM AEDT.
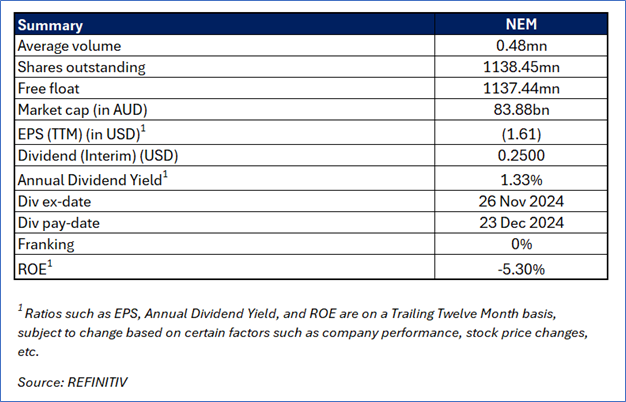
Newmont Corporation (ASX: NEM)
Newmont Corporation (ASX: NEM) is the world's largest gold mining company, also producing copper, silver, zinc, and lead. Headquartered in Greenwood Village, Colorado, Newmont's operations span across North America, South America, Australia, and Africa.
Recommendation Rationale - SELL at AUD 74.99
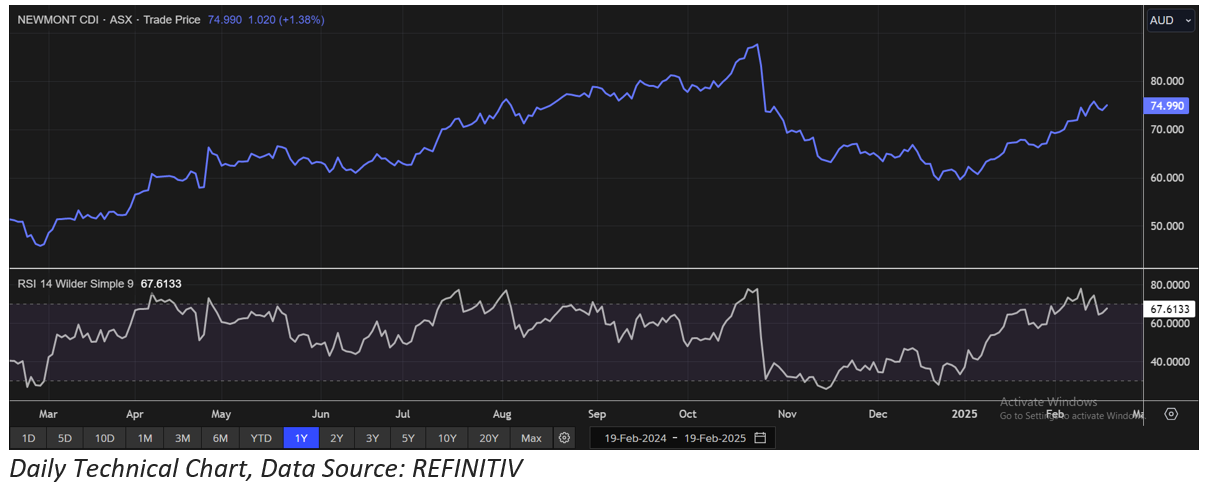
- Facing Resistance: NEM has surpassed the ‘Resistance 1’ level recommended on 28 January 2025 and can face resistance at the current levels.
- Overbought Technical Stance: The momentum oscillator, 14-day RSI is showing a reading of around 67.61, indicating that NEM is approaching the overbought zone and may face resistance in the short-term.
- Primary Risk: Newmont’s revenue and profitability are highly dependent on gold prices, which are influenced by factors like inflation, interest rates, geopolitical tensions, and central bank policies.
- Increased Costs: During Q3 FY24, Gold AISC ((All-In Sustaining Cost) per ounce increased by 3% YoY, primarily due to 5% YoY increase in Gold CAS as directed costs increased at Lihir Mine.
Daily Price Chart
Valuation Methodology: Price/Cash Flow Approach (FY Dec'25E) (Illustrative)
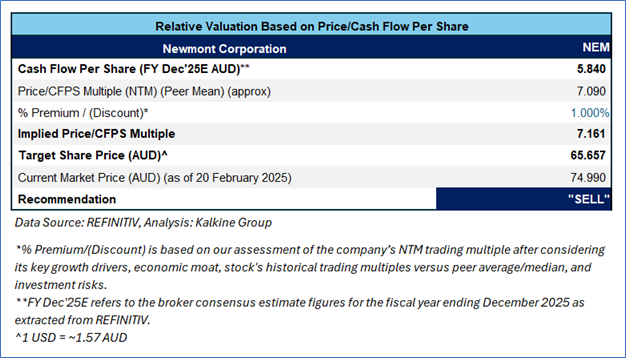
NEM is expected to trade at a slight premium compared to its peers considering the 4% YoY increase in gold production in Q3 FY24, reduced nominal debt, and achievement of acquisition synergy from the Newcrest acquisition. For conducting valuation, the following peers have been considered: Northern Star Resources Ltd (ASX: NST), Gold Road Resources Ltd (ASX: GOR), and Perseus Mining Ltd (ASX: PRU).
Considering the rally in share price movement, current trading level, and risks associated, the share price can witness resistance at the current levels. Hence, a ‘Sell’ recommendation is given on the stock at the current market price of AUD 74.99, as of 19 February 2025, at 12:55 PM AEDT.
Markets are trading in a highly volatile zone currently due to certain macro-economic issues and geopolitical issues prevailing geopolitical tensions. Therefore, it is prudent to follow a cautious approach while investing.
Note 1: Past performance is neither an indicator nor a guarantee of future performance.
Note 2: The reference date for all price data, currency, technical indicators, support, and resistance levels is 19 February 2025. The reference data in this report has been partly sourced from REFINITIV.
Note 3: Investment decisions should be made depending on an individual's appetite for upside potential, risks, holding duration, and any previous holdings. An 'Exit' from the stock can be considered if the Target Price mentioned as per the Valuation and or the technical levels provided has been achieved and is subject to the factors discussed above.
Note 4: Kalkine reports are prepared based on the stock prices captured either from REFINITIV or Trading View. Typically, REFINITIV or Trading View may reflect stock prices with a delay which could be a lag of 25-30 minutes. There can be no assurance that future results or events will be consistent with the information provided in the report. The information is subject to change without any prior notice.
Note 5: Dividend Yield may vary as per the stock price movement.
Technical Indicators Defined: -
Support: A level at which the stock prices tend to find support if they are falling, and a downtrend may take a pause backed by demand or buying interest. Support 1 refers to the nearby support level for the stock and if the price breaches the level, then Support 2 may act as the crucial support level for the stock.
Resistance: A level at which the stock prices tend to find resistance when they are rising, and an uptrend may take a pause due to profit booking or selling interest. Resistance 1 refers to the nearby resistance level for the stock and if the price surpasses the level, then Resistance 2 may act as the crucial resistance level for the stock.
Stop-loss: It is a level to protect further losses in case of unfavourable movement in the stock prices.
 AU
AU

 Please wait processing your request...