This report is an updated version of the report published on 29 January 2026 at 11:15 AM AEDT.

Capricorn Metals Limited (ASX: CMM)
Company Overview: Capricorn Metals Limited (ASX: CMM) is an Australian gold exploration and production company focused on the Karlawinda Gold Project in Western Australia. The company operates the Karlawinda Expansion Project (KEP) to increase production capacity and develop infrastructure. CMM also explores and develops additional gold projects.
Recommendation Rationale – SELL at AUD 16.480
- Technical Standpoint: CMM share price is trading around R1 level recommended on 19 January 2026, while 14-day RSI (~64.85) is approaching the overbought zone. Therefore, it may face resistance at the current levels.
- Production Momentum is Already Rolling Over: Quarterly gold production declined QoQ (30,476oz in Q2 FY26 vs 32,318oz in Q1 FY26), despite gold prices being near cycle highs. This indicates that recent earnings strength is more price-driven than volume-driven, increasing sensitivity to any gold price pullback.
- Costs are At the Top End of Guidance: The AISC of ~AU$1,627/oz in Q2 FY26 sits right at the upper bound of FY26 guidance, leaving limited buffer against diesel and labour inflation, higher sustaining capital as stripping intensifies, and margin compression risk rises sharply if gold normalises.
- Peak Margins Limit Further Upside: With gold prices elevated, CMM is trading on peak margins, peak sentiment, and optimistic execution assumptions. The recent quarterly report confirms solid operations, but also highlights rising costs, heavier stripping, execution risk, and declining production momentum — all of which argue for locking in gains rather than pressing exposure at this stage of the cycle.
Daily Price Chart
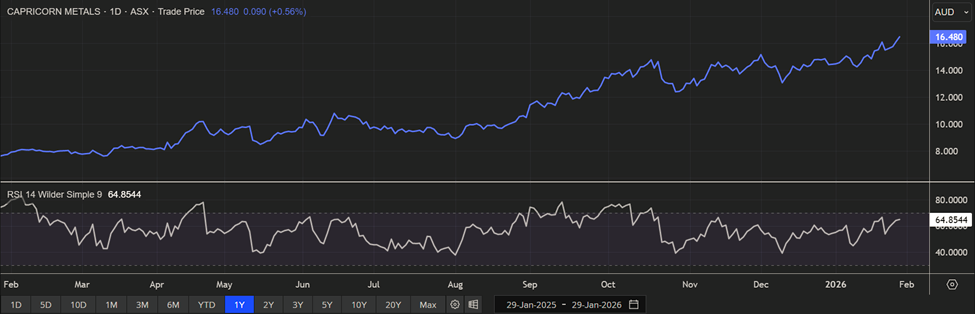
(Daily Technical Chart; Source: REFINITIV)
Valuation Methodology: Price/Cash Flow Approach (Illustrative)
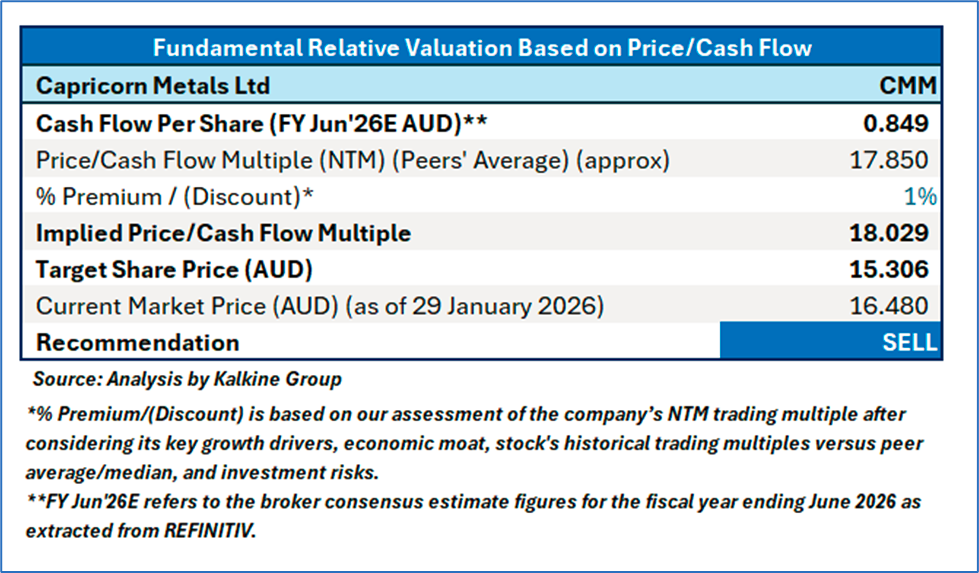
The stock might trade at a slight premium to its peers given the 414% YoY increase in FY25 Net Cash position, 72% YoY increase in FY25 NPAT, long-life optionality, among others.
For conducting the valuation, following peers have been considered - Pls Group Ltd (ASX: PLS), Ramelius Resources Ltd (ASX: RMS), and Greatland Resources Ltd (ASX: GGP).
Given the stock is approaching its R1 level, recent rally in the share price, and risks associated, it is prudent to sell the stock at the current levels. Hence, a ‘Sell’ recommendation is given on the stock at the current market price of AUD 16.480, as of 29 January 2026, at 10:45 AM AEDT.
Markets are trading in a highly volatile zone currently due to certain macro-economic issues and geopolitical issues prevailing geopolitical tensions. Therefore, it is prudent to follow a cautious approach while investing.
Note 1: Past performance is neither an indicator nor a guarantee of future performance.
Note 2: The reference date for all price data, currency, technical indicators, support, and resistance levels is 29 January 2026. The reference data in this report has been partly sourced from REFINITIV.
Note 3: Investment decisions should be made depending on an individual's appetite for upside potential, risks, holding duration, and any previous holdings. An 'Exit' from the stock can be considered if the Target Price mentioned as per the Valuation and or the technical levels provided has been achieved and is subject to the factors discussed above.
Note 4: Kalkine reports are prepared based on the stock prices captured either from REFINITIV or Trading View. Typically, REFINITIV or Trading View may reflect stock prices with a delay which could be a lag of 25-30 minutes. There can be no assurance that future results or events will be consistent with the information provided in the report. The information is subject to change without any prior notice.
Technical Indicators Defined: -
Support: A level at which the stock prices tend to find support if they are falling, and downtrend may take a pause backed by demand or buying interest.
Resistance: A level at which the stock prices tend to find resistance when they are rising, and uptrend may take a pause due to profit booking or selling interest.
Stop-loss: In general, it is a level to protect further losses in case of any unfavourable movement in the stock prices.

 CA
 NZ
 UK
 US
 IND

 AU

 Please wait processing your request...