Lovisa Holdings Limited (ASX: LOV)
Lovisa Holdings Limited is an ASX listed fashion jewelry and accessories retailer.
Recommendation Rationale – SELL at AUD 20.84
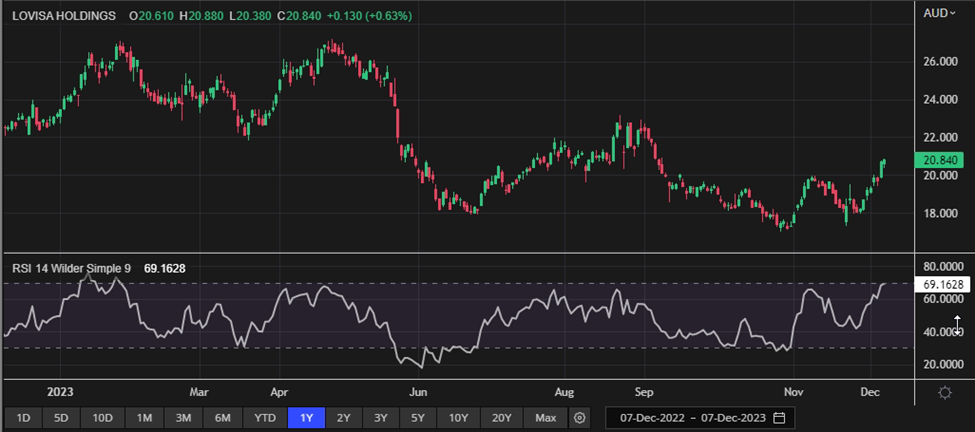
- Technical Indicator: The momentum oscillator 14-Day RSI (~69.16) is approaching the overbought zone; and thus, price can face correction in the short term.
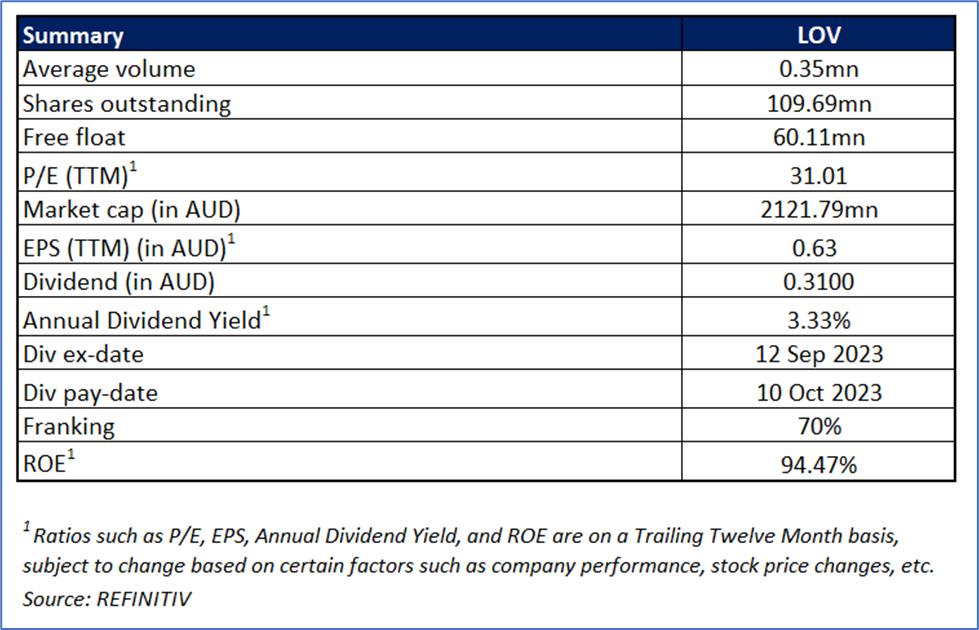
- Overvalued Multiples: On a 12–month forward basis – key trading multiples (EV/Sales, EV/EBITDA, Price/Earnings, and Price/Cash Flow) are higher than the median of the Consumer Cyclicals sector.
- Sales Decline: For the first 20 weeks of FY24, global comparable store sales declined 6.2% YoY.
- Dividend Decline: On a statutory basis, the final dividend in FY23 was 6 cents lower than FY22, reflecting the inflationary pressure.
- Q3 Australia GDP: The Q3 2023 GDP were below the market expectations since consumption hits weakest since early 2021.
LOV’s Daily Chart

(Source: REFINITIV, Analysis by Kalkine Group)
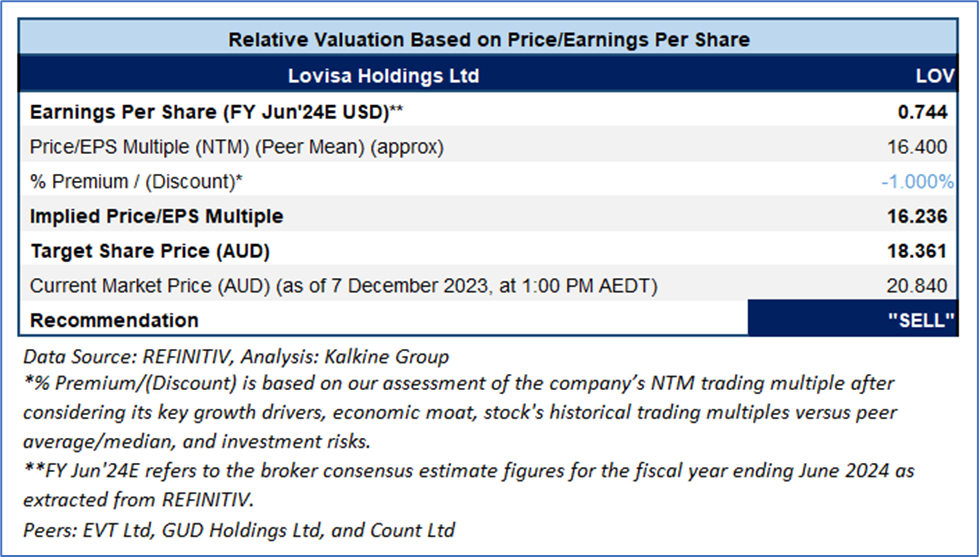
Valuation Methodology: Price/Earnings Approach (FY24E) (Illustrative)

Considering that the resistance level, and risks associated, it is prudent to book profit at the current levels. Hence, a ‘Sell’ recommendation is given on the stock at the current price of AUD 20.84 (as of 7 December 2023, at 1:00 PM AEDT).
Markets are trading in a highly volatile zone currently due to certain macro-economic issues and geopolitical tensions prevailing. Therefore, it is prudent to follow a cautious approach while investing.
Note 1: Past performance is neither an indicator nor a guarantee of future performance.
Note 2: The reference date for all price data, currency, technical indicators, support, and resistance levels is 7 December 2023. The reference data in this report has been partly sourced from REFINITIV.
Note 3: Investment decisions should be made depending on an individual's appetite for upside potential, risks, holding duration, and any previous holdings. An 'Exit' from the stock can be considered if the Target Price mentioned as per the Valuation and or the technical levels provided has been achieved and is subject to the factors discussed above.
Note 4: Dividend Yield may vary as per the stock price movement.
Technical Indicators Defined: -
Support: A level at which the stock prices tend to find support if they are falling, and downtrend may take a pause backed by demand or buying interest.
Resistance: A level at which the stock prices tend to find resistance when they are rising, and uptrend may take a pause due to profit booking or selling interest.
Stop-loss: In general, it is a level to protect further losses in case of any unfavourable movement in the stock prices.
AU


 Please wait processing your request...