Company Overview: Treasury Wine Estates (ASX: TWE) is an ASX listed global wine company headquartered in Melbourne, Australia. It operates as an end-to-end wine business focused on producing premium still and sparkling wines for its priority markets worldwide. Kalkine’s Daily Report covers the Key Financial Metrics, Risks, Outlook, Technical Analysis along with the Valuation, Target Price, and Recommendation on the stock.
Section 1.0: Key Metrics in Pictures
Having looked at the key financial ratios above the below sections provide an in-depth fundamental, and technical analysis on ‘Food, Beverage & Tobacco’ stock along with recommendations, technical support and resistance levels and indicative stop-loss.
Section 2.0: Treasury Wine Estates Ltd (ASX: TWE) (‘Buy’ at AUD 8.10, Closing Market Price as on 2 June 2025)
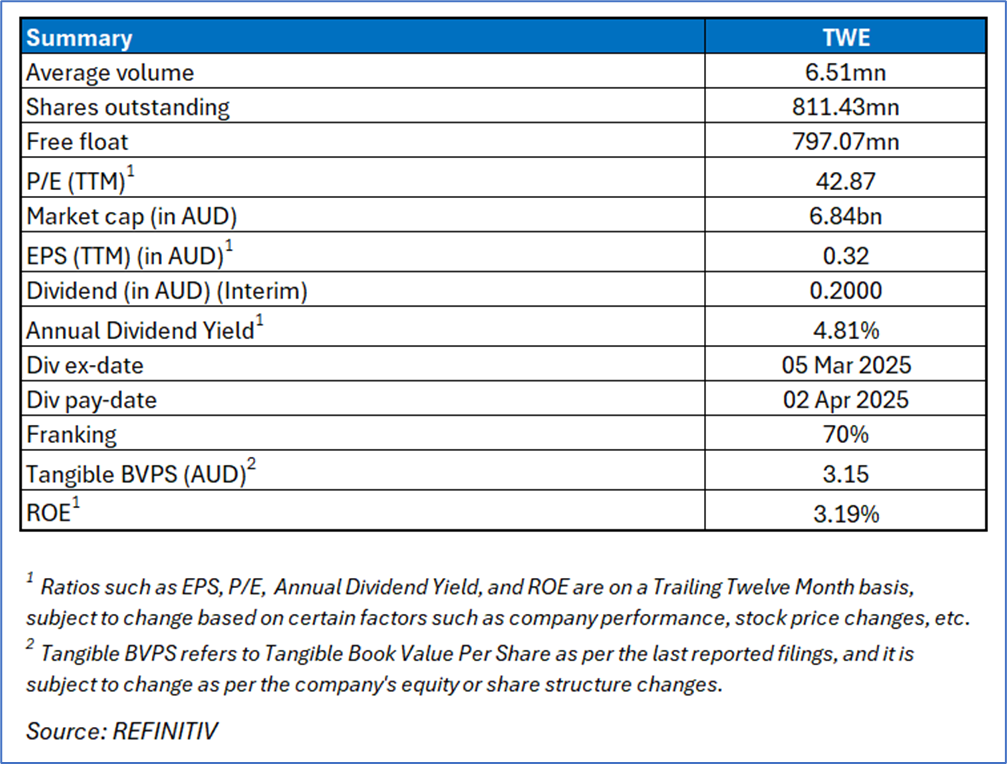
2.1 Company Details
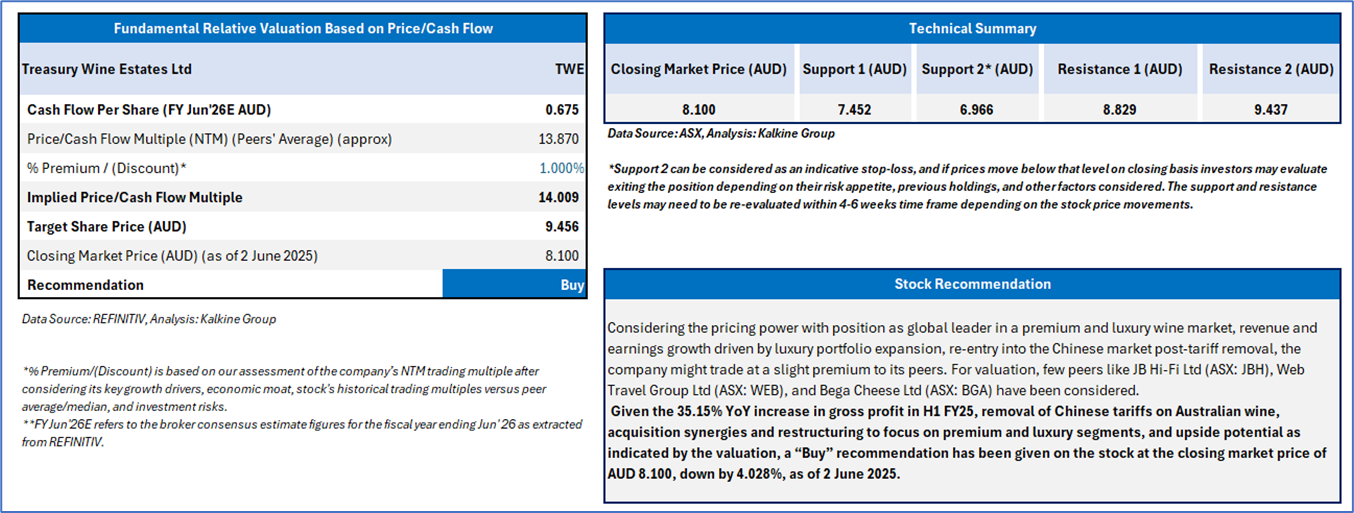
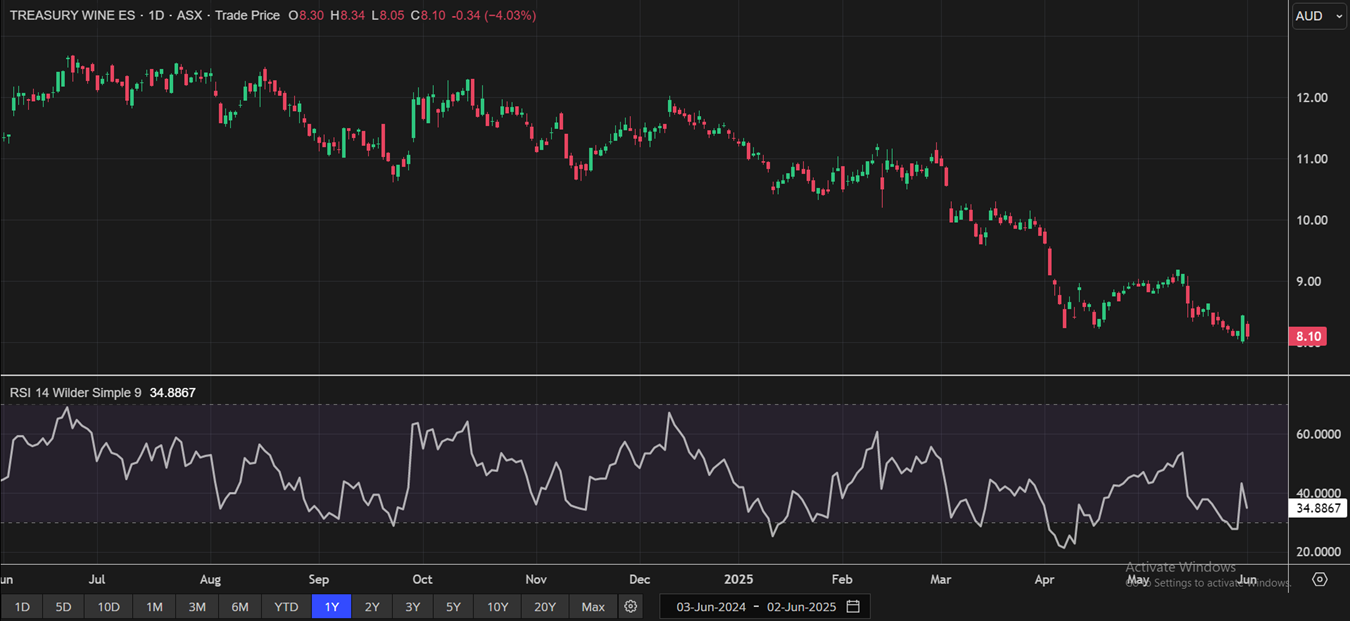
2.2 Valuation, Stock Recommendation, and Technical Guidance
The stock price has decreased around 9.70% in the last one month and over the last six months, it has been corrected by around 28.26%. The stock has a 52-week low and 52-week high of AUD 7.980 and AUD 12.690, respectively and is currently trading below the 52-week mid-level. TWE was previously covered in a report dated ‘5 May 2025’.
(Source: REFINITIV; Analysis by Kalkine Group)
Note 1: Past performance is not a reliable indicator of future performance.
Note 2: The reference date for all price data, currency, technical indicators, support, and resistance levels is 2 June 2025. The reference data in this report has been partly sourced from REFINITIV.
Note 3: Investment decisions should be made depending on an individual's appetite for upside potential, risks, holding duration, and any previous holdings. An 'Exit' from the stock can be considered if the Target Price mentioned as per the Valuation and or the technical levels provided has been achieved and is subject to the factors discussed above.
Note 4: Dividend Yield may vary as per the stock price movement.
Note 5: Kalkine reports are prepared based on the stock prices captured either from REFINITIV or Trading View. Typically, REFINITIV or Trading View may reflect stock prices with a delay which could be a lag of 25-30 minutes. There can be no assurance that future results or events will be consistent with the information provided in the report. The information is subject to change without any prior notice.
Technical Indicators Defined: -
Support: A level at which the stock prices tend to find support if they are falling, and a downtrend may take a pause backed by demand or buying interest. Support 1 refers to the nearby support level for the stock and if the price breaches the level, then Support 2 may act as the crucial support level for the stock.
Resistance: A level at which the stock prices tend to find resistance when they are rising, and an uptrend may take a pause due to profit booking or selling interest. Resistance 1 refers to the nearby resistance level for the stock and if the price surpasses the level, then Resistance 2 may act as the crucial resistance level for the stock.
Stop-loss: It is a level to protect further losses in case of unfavourable movement in the stock prices.
 AU
AU

 Please wait processing your request...