This report is an updated version of the report published on 9 September 2024 at 3:57 PM AEST.
Cettire Ltd (ASX: CTT)
Cettire Ltd is an Australian-based online luxury fashion retailer specializing in high-end designer apparel, accessories, and footwear.
Recommendation Rationale – SELL at AUD 1.780
- Profit Decline: During FY24 (for the year ended 30 June 2024), CTT’s Net Profit After Tax attributable to members declined by 34% YoY.
- Trading Around Resistance: CTT’s share price has surpassed the ‘Resistance 2’ level recommended on 2 September 2024; thus, share price can face resistance at the current levels.
- Overvalued Multiples: On a forward 12-month basis – key trading multiples (EV/EBITDA, Price/Earnings, Price/Book and Price/Cash Flow) are higher than the average of Specialty Retail sector.
- Economic Downturns: Luxury goods are often seen as discretionary purchases, and demand can be sensitive to economic fluctuations. During economic downturns or periods of financial instability, consumers may reduce spending on high-end products, potentially impacting Cettire’s sales and profitability.
CTT Daily Chart
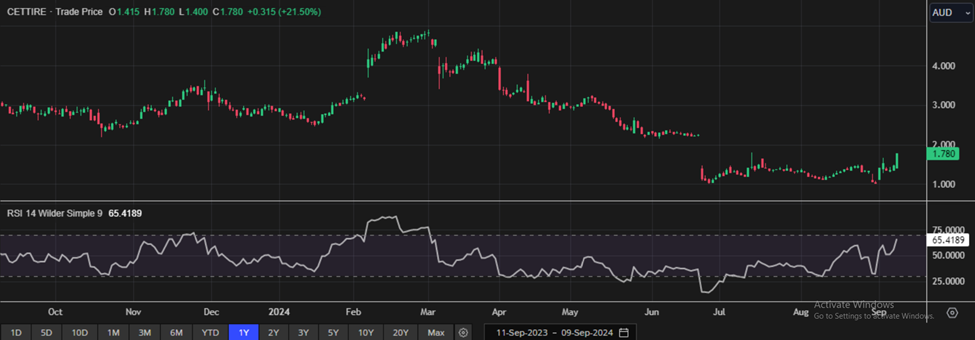
(Source: REFINITIV; Analysis by Kalkine Group)
Valuation Methodology: Price/Cash Flow Approach (FY Jun'25E) (Illustrative)
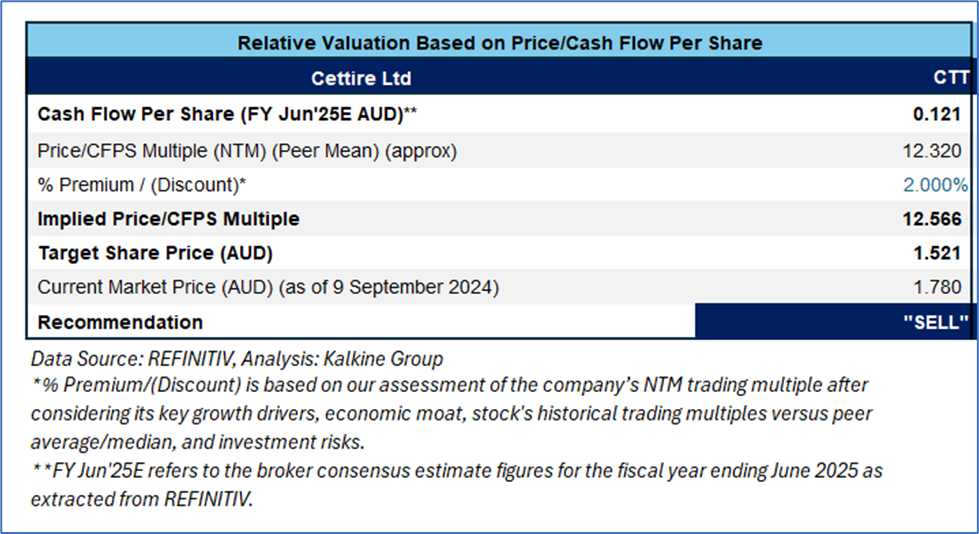
CTT is likely to trade at a slight premium as it reported 81% and 64% YoY growth in gross revenue and active customers in FY24, respectively. The following peers have been considered for conducting valuation: Premier Investments Ltd (ASX: PMV), Corporate Travel Management Ltd (ASX: CTD), and Keypath Education International Inc (ASX: KED).
Given its current trading levels, market uncertainties, and risks associated, the share price can witness resistance at the current levels. Hence, a ‘Sell’ recommendation is given on the stock at the current market price of AUD 1.780, as of 9 September 2024 at 3:00 PM AEST.
Markets are trading in a highly volatile zone currently due to certain macro-economic issues and geopolitical issues prevailing geopolitical tensions. Therefore, it is prudent to follow a cautious approach while investing.
Note 1: Past performance is neither an indicator nor a guarantee of future performance.
Note 2: The reference date for all price data, currency, technical indicators, support, and resistance levels is 9 September 2024. The reference data in this report has been partly sourced from REFINITIV.
Note 3: Investment decisions should be made depending on an individual's appetite for upside potential, risks, holding duration, and any previous holdings. An 'Exit' from the stock can be considered if the Target Price mentioned as per the Valuation and or the technical levels provided has been achieved and is subject to the factors discussed above.
Technical Indicators Defined: -
Support: A level at which the stock prices tend to find support if they are falling, and downtrend may take a pause backed by demand or buying interest.
Resistance: A level at which the stock prices tend to find resistance when they are rising, and uptrend may take a pause due to profit booking or selling interest.
Stop-loss: In general, it is a level to protect further losses in case of any unfavourable movement in the stock prices.
 AU
AU

 Please wait processing your request...