Carlisle Companies Inc
Carlisle Companies Inc (NYSE: CSL) is a building products manufacturer focused on energy-efficient building envelope solutions. It operates through two segments: Carlisle Construction Materials (CCM), which provides roofing systems and insulation products for commercial and residential buildings, and Carlisle Weatherproofing Technologies (CWT), which offers waterproofing, moisture protection, and air/vapor barrier solutions to enhance building sustainability and performance.

Financial Performance Overview for The Three Months Ended (Q1FY26)
- Revenue Decline Driven by External Headwinds: Carlisle reported revenue of approximately USD 1.05 billion in Q1 2026, reflecting a decline of around 4% year-over-year, primarily impacted by unfavorable weather conditions and prior-period tariff-related order pull-forward effects. Organic revenue declined by roughly 5%, as harsh winter conditions limited construction activity, particularly reducing contractor productivity and delaying project execution timelines. Additionally, continued softness in both residential and non-residential new construction markets weighed on volume growth.
- Margin Expansion Supported by Operational Discipline: Despite top-line pressure, the company demonstrated strong operational execution, with adjusted EBITDA margin expanding by 50 basis points to 22.3%. This improvement was driven by productivity gains under the Carlisle Operating System (COS), procurement discipline, and effective cost control measures across selling and administrative expenses. The ability to expand margins in a declining revenue environment highlights management’s focus on efficiency and profitability.
- Earnings Stability Through Capital Allocation Strategies: Adjusted EPS increased modestly by 1% year-over-year to USD 3.63, reflecting resilience in bottom-line performance. This growth was supported by share repurchases, which offset the impact of lower organic earnings and higher net interest expenses. The company returned approximately USD 296 million to shareholders during the quarter, including USD 250 million in buybacks, reinforcing its commitment to shareholder returns.
Operational Performance and Segment Analysis
- CCM Segment: Margin Strength Despite Volume Weakness: The Carlisle Construction Materials (CCM) segment reported a revenue decline of 5% to USD 758 million, primarily due to weather-related disruptions and ongoing weakness in new construction activity. However, adjusted EBITDA margin expanded by 30 basis points to 27.4%, supported by strong re-roofing demand and operational efficiencies. This indicates a favorable mix shift toward higher-margin recurring repair and replacement activities.
- CWT Segment: Volume Pressure Offsetting Operational Gains: The Carlisle Weatherproofing Technologies (CWT) segment saw a marginal revenue decline of 1% to USD 294 million, with acquisitions partially offsetting lower organic volumes. Adjusted EBITDA margin declined by 40 basis points to 15.2%, primarily due to volume deleverage, although operational improvements such as footprint consolidation and expanded in-house production capabilities provided partial mitigation.
Liquidity, Cash Flow, and Outlook
- Strong Balance Sheet with Temporary Cash Flow Pressure: Carlisle maintained a strong liquidity position with total liquidity of approximately USD 1.8 billion, including USD 771 million in cash. However, operating cash flow was negative at USD 44.7 million, and free cash flow stood at negative USD 73 million, largely due to seasonal working capital investments and a one-time tax-related payment. Despite this, leverage remained controlled with a net debt-to-EBITDA ratio of 1.7x, indicating balance sheet stability.
- Outlook Supported by Pricing and Strategic Execution: The company reaffirmed its full-year outlook, targeting low single-digit revenue growth and approximately 50 basis points of adjusted EBITDA margin expansion. Growth is expected to be driven by pricing actions to offset raw material inflation, continued re-roofing demand, acquisition integration, and operational efficiencies. Management remains focused on achieving long-term targets under its Vision 2030 strategy, including strong ROIC and double-digit EPS growth.
Key Risks:
- Exposure to Construction Cyclicality: Continued weakness in residential and non-residential construction may pressure volumes and revenue growth.
- Raw Material Inflation Risk: Rising petrochemical-linked input costs could impact margins if not fully passed through via pricing.
- Weather and Seasonality Impact: Adverse weather conditions can disrupt project timelines and contractor activity, affecting near-term performance.
- Integration and Execution Risk: Dependence on successful acquisition integration and operational execution to sustain margin improvements.
Technical Observation (on the daily chart):
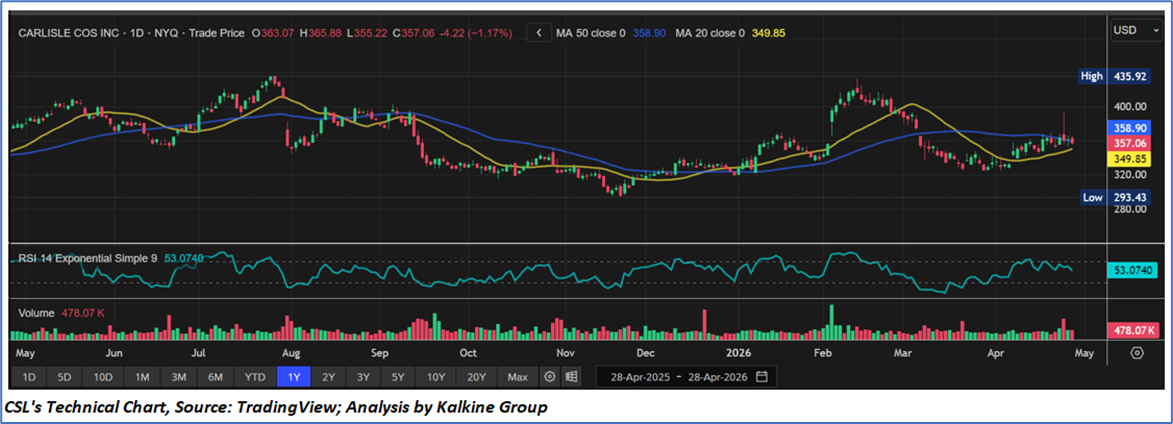
- The stock is trading within a broad range between approximately USD 295 (support) and USD 435 (resistance), indicating an extended consolidation phase.
- The price has rebounded from the lower range near USD 320–330 and is currently stabilizing around USD 357, suggesting buying interest at lower levels.
- The stock is trading close to its 50-day moving average (USD 358.90) and above the 20-day moving average (USD 349.85), indicating improving short-term momentum.
- The RSI is around 53, indicating neutral momentum with a slight positive bias and no signs of overbought or oversold conditions.
- Increased volume near recent lows and during upward price movements indicates potential accumulation, though stronger confirmation is needed.
Carlisle demonstrated strong operational resilience in Q1 2026 by expanding margins and sustaining earnings despite revenue headwinds from weather and weak construction demand, supported by disciplined cost management, pricing actions, and shareholder-focused capital allocation
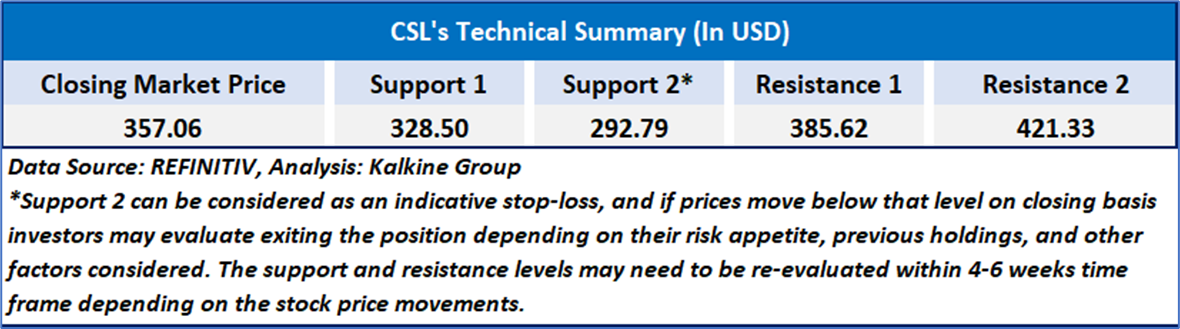
As per the above-mentioned price action, recent key business and financial updates, momentum in the stock over the last month, and technical indicators analysis, a ‘Buy’ rating has been given Carlisle Companies Inc (NYSE: CSL) at the closing market price of USD 357.06, as of April 28,2026.
Individuals can evaluate the stock based on the support and resistance levels provided in the report in case of keen interest taking into consideration the risk-reward scenario.
Markets are trading in a highly volatile zone currently due to certain macro-economic issues and prevailing geopolitical tensions. Therefore, it is prudent to follow a cautious approach while investing.
Related Risk: This report may be looked at from a high-risk perspective and a recommendation is provided for a short duration. This report is solely based on technical parameters, and the fundamental performance of the stocks has not been considered in the decision-making process. Other factors which could impact the stock prices include market risks, regulatory risks, interest rates risks, currency risks, social and political instability risks etc.
Note 1: Past performance is not a reliable indicator of future performance.
Note 2: The reference date for all price data, currency, technical indicators, support, and resistance level is April 28,2026. The reference data in this report has been partly sourced from REFINITIV.
Note 3: Investment decisions should be made depending on an individual's appetite for upside potential, risks, holding duration, and any previous holdings. An 'Exit' from the stock can be considered if the Target Price mentioned as per the Valuation and or the technical levels provided has been achieved and is subject to the factors discussed above.
Note 4: Target Price refers to a price level that the stock is expected to reach as per the relative valuation method and or technical analysis taking into consideration both short-term and long-term scenarios.
Note 5: ‘Kalkine reports are prepared based on the stock prices captured either from the New York Stock Exchange (NYSE), NASDAQ Capital Markets (NASDAQ), and or REFINITIV. Typically, all sources (NYSE, NASDAQ, or REFINITIV) may reflect stock prices with a delay which could be a lag of 15-20 minutes. There can be no assurance that future results or events will be consistent with the information provided in the report. The information is subject to change without any prior notice.

 CA
 NZ
 UK
 US
 IND

 AU

 Please wait processing your request...