Bloom Energy Corporation
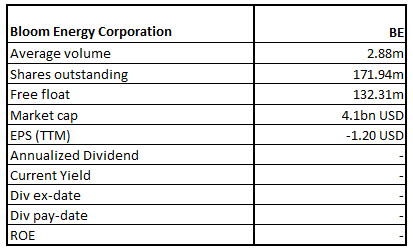
BE Details
Bloom Energy Corporation (NYSE: BE) deals in the business of providing clean, reliable, and affordable energy. It has developed an energy server platform which is a stationary power generation platform. This platform can deliver uninterrupted, 24x7 constant power which is clean as well as sustainable.
FY20 Results Performance
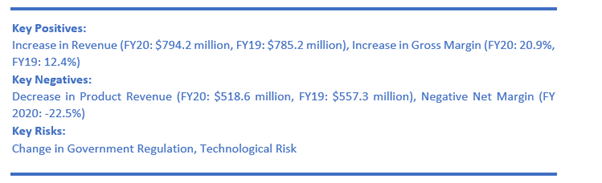
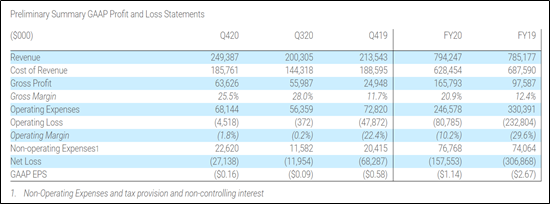
The company has reported a decent performance in FY20 with 1.1% YoY rise in revenue to $794.2 million as against $785.2 million in 2019 supported by 11.1% rise in acceptances to 1,326, or 132.6 MW. Notably, the company witnessed a significant improvement in its gross margin to 20.9% in FY20 from 12.4% in FY19, a rise of 8.5 percentage points mainly assisted by uptick in product gross margin to 35.8% from 21.9%. The increase in product margin was aided by cost reduction outpacing ASP reductions.
The company’s cash position, including restricted cash, decreased to $416.7 million at the end of December 31, 2020 from $504.4 million as of September 30, 2020. The company ended the year with $527.1 million of debt, reflecting a fall of $180.1 million from the Q3 FY 2020, which included the reduction of $175.5 million in recourse debt.
Financial Snapshot (Source: Company Reports)
Install Over 40 Megawatts of Energy in the Northeast
The company on 30 March 2021 declared that it has started to deploy a portfolio of over 40 megawatts of solid oxide fuel cells in the Northeast via the series of agreements under the Community Distributed Generation (or CDG) program, that encourages investment as well as deployment of clean energy technologies.
The current CDG program incentivizes developers to install clean power generation within the grid distribution network to alleviate stress on the electric grid, reduce harmful greenhouse gas emissions as well as air pollutants, decrease costs, as well as enhance energy reliability.
Outlook
The company has guided of achieving revenue in the range of $950 million - $1 billion in FY21. It also expects to garner Non-GAAP gross margin of ~25% in FY21 and non-GAAP operating margin of around 3% in FY21, without taking into consideration the stock-based compensation.
Key Risks
The company’s operations are exposed to global economic conditions and uncertainties in the geopolitical environment where it operates. Further, the company’s energy servers have tremendous upfront costs and the company would need to attract investors to help the customers in financing purchases. Other risks include manufacturing risks, intellectual property risks as well as lengthy sales and installation cycle of its products, etc.
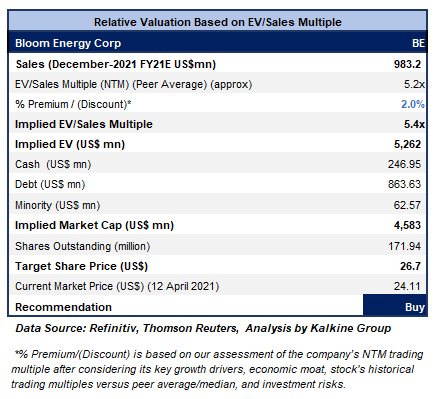
Valuation Methodology: EV/Sales Based Relative Valuation (Illustrative)
Technical Overview:
Weekly Chart –
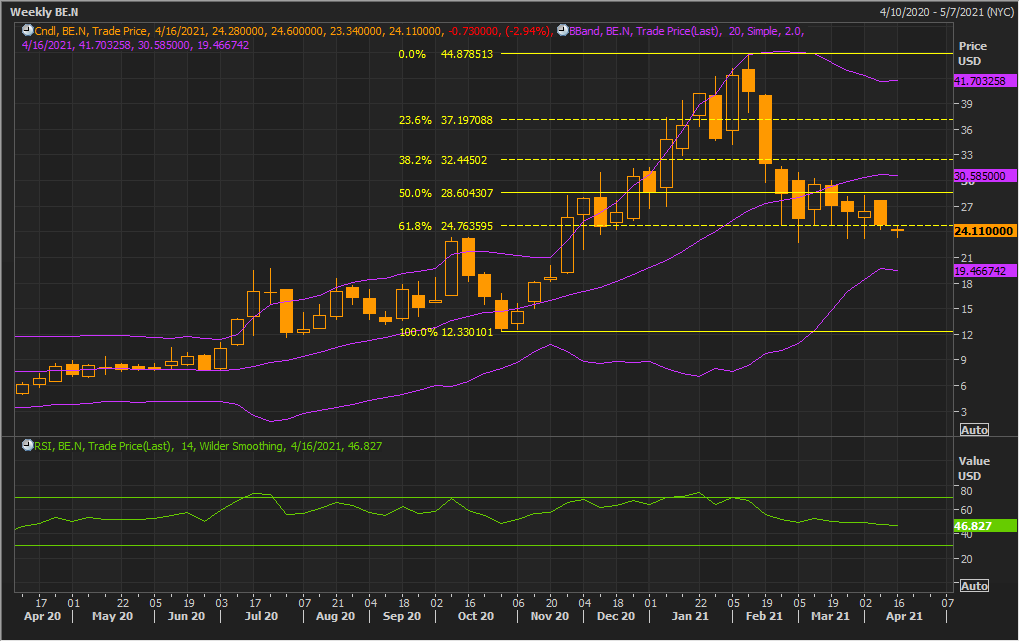
Source: Refinitiv (Thomson Reuters)
Note: Purple colour lines are Bollinger Bands® with the upper band suggesting overbought status while the lower band oversold status, and yellow lines are Fibonacci retracement lines which measure price rebound and backtrack. https://www.bollingerbands.com/
Amidst low volatility, the stock has given a lower close for the ongoing week, with a ‘Doji’ candle formed on the chart which could be towards bullish reversal for it. The technical indicator RSI with a reading around 47 suggests gaining of bullish momentum for the stock.
Going forward, the stock may have resistance around the 50% retracement level of $28.60 whereas support could be around the lower Bollinger band of $19.47.
Stock Recommendation
BE has delivered 6-month and 9-month returns of ~9.99% and ~99.09%, respectively. The stock has made a 52-week low and high of $5.81 and $44.95, respectively.
We have valued the stock using an EV/Sales multiple-based illustrative relative valuation and have arrived at a target price which reflects a rise of low double-digit (in % terms). We have assigned a slight premium to EV/Sales Multiple (NTM) (Peer Average) considering the focus towards achieving profitability in 2021, significant growth opportunities and expectations that scalability and cost-out would be driving to 20% target service gross margin by 2025. For the purposes, we have taken peers like Rockwell Automation Inc (ROK.N), AMETEK Inc (AME.N), Romeo Power Inc (RMO.N), to name a few.
Meanwhile, the company highlighted that driven by the traction in its bookings in H2FY20 coupled with healthy backlog for 2021 enlightens high project visibility into the 2021 guidance framework as well as improving cash flow outlook.
Besides, the company is making significant strides in lowering its product costs, while sustaining investments on technology.
Given the decent financial performance in FY20, liquidity position and outlook, we give a “Buy” recommendation on the stock at the current market price of $24.11 per share, down by 2.94% on 12th April 2021.
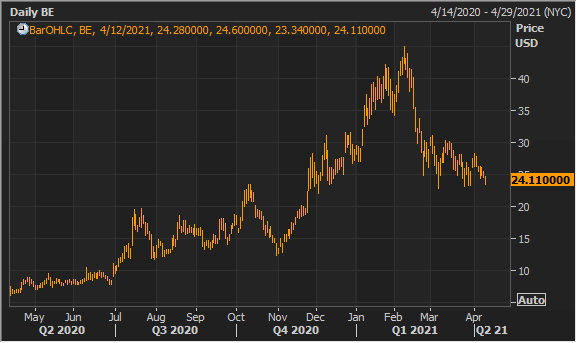
BE Daily Technical Chart (Source: Refinitiv (Thomson Reuters))
Ormat Technologies Inc.
ORA Details
Ormat Technologies, Inc. (NYSE: ORA) is engaged in the business of providing renewable power and energy solutions to its customers globally. Notably, clean, reliable energy solutions provided from the geothermal, recovered energy as well as energy management and storage solutions is the company’s expertise and commitment.
FY20 Results Performance
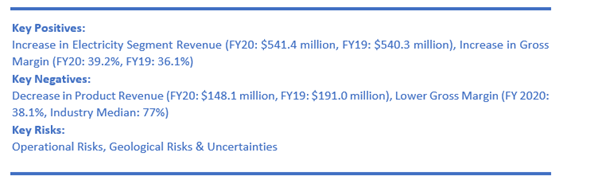
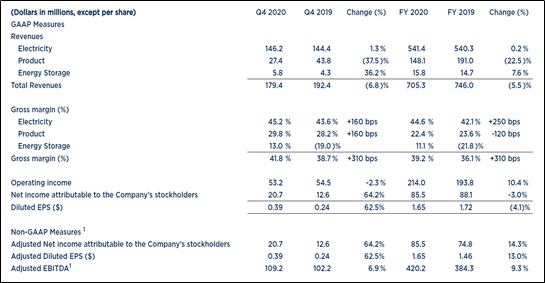
The company witnessed weak revenue performance in its product segment wherein the revenue decreased by 22.5% YoY to $148.1 million in FY20, which overshadowed the increase in revenue from both electricity segment and energy storage segment during the year. While revenue from electricity segment grew by 0.2% YoY to $541.4 million, revenue from energy storage segment rose to $15.8 million in FY20 from $14.7 million in FY 2019. Resultantly, overall revenue of the company during the period reduced by 5.5% YoY to $705.3 million.
However, the company witnessed 310 bps improvement in its gross margin to 39.2%. Meanwhile, net income attributable to the company’s stockholders reduced by 3% YoY to $85.5 million mainly due to the inclusion of effect of non-recurring tax benefit in the previous year. However, excluding the same, net income attributable to the company's stockholders grew by 14.3%.
Meanwhile, the board of directors of the company has announced a quarterly dividend of $0.12 per share on February 24, 2021.
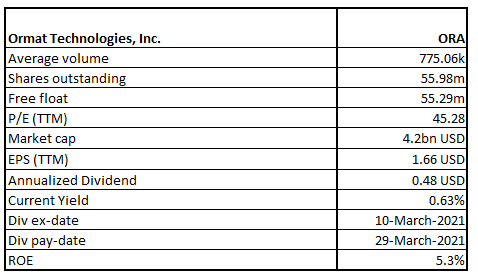
Financial Snapshot (Source: Company Reports)
Start of Commercial Operation
On 1st April 2021, the company announced the commercial operation of the 10 MW/40 MWh Vallecito Battery Energy Storage System (or Vallecito BESS). The Vallecito BESS gives local resource adequacy to Southern California Edison (or SCE) under the 20-year energy storage resource adequacy agreement. Apart from this, this particular facility will also indulge in delivering ancillary services along with energy optimization by way of involvement in merchant markets which is being run by the California Independent System Operator (or CAISO).
Outlook
ORA has guided of generating revenue in the range of $640 million and $675 million for FY21 and electricity segment revenues is expected to be in the range of $570 million and $580 million, while it anticipates to garner revenue of between $50 million and $70 million from product segment and between $20 million and $25 million revenue from energy storage segment in FY21.
Moreover, the company anticipates of achieving adjusted EBITDA in the range of $400 million and $410 million in FY21. Besides, ORA remains hopeful of paying a quarterly dividend of $0.12 per share in the each of the upcoming three quarters.
Key Risks
The company’s global operations are exposed to risks related to the application of foreign laws as well as regulations and political or economic instability.
Besides, sustained reduction in products backlog might affect the company’s ability of full utilization of the main production as well as manufacturing facilities.
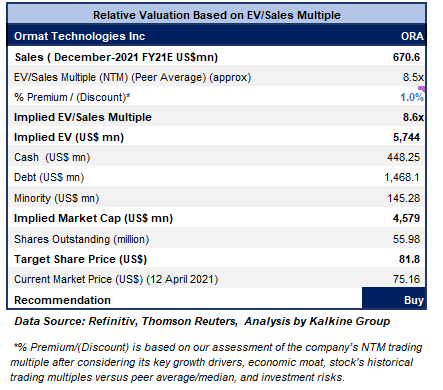
Valuation Methodology: EV/Sales Based Relative Valuation (Illustrative)
Technical Overview:
Weekly Chart –
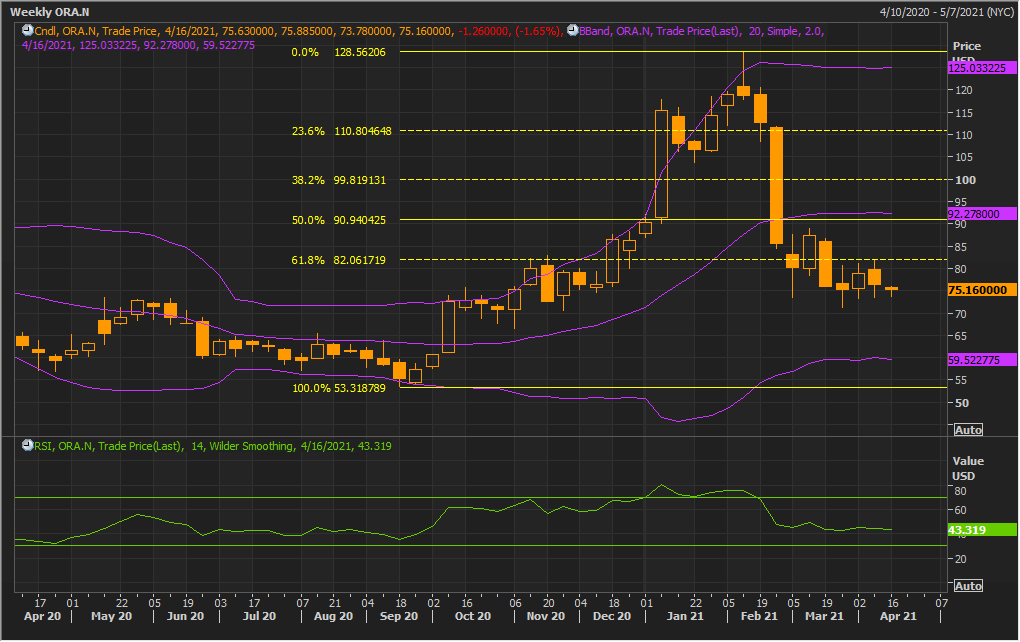
Source: Refinitiv (Thomson Reuters)
Note: Purple colour lines are Bollinger Bands® with the upper band suggesting overbought status while the lower band oversold status, and yellow lines are Fibonacci retracement lines which measure price rebound and backtrack. https://www.bollingerbands.com/
Having caught under sell-off at its high price of $128.56, the stock fell close to $70.00 level, and from there it has been trying to move up. In the meantime, the stock has given close at $15.16 for the ongoing week, forming a ‘Hammer’ on the chart which could be towards a bullish reversal. The technical indicator RSI with a reading around 43 and a flattish curve at the end, suggests neutral momentum for the stock.
Going forward, the stock may have resistance around the 50% retracement level of $90.94 whereas support could be around $70.00.
Stock Recommendation
ORA has delivered 6-month and 9-month returns of ~0.48% and ~21.2%, respectively. The stock has made a 52-week low and high of $53.44 and $128.87, respectively. It is trading lower than the average of the 52-week high and low price, which indicates a good opportunity for accumulation.
We have valued the stock using an EV/Sales multiple-based illustrative relative valuation and have arrived at a target price which reflects a rise of high single-digit (in % terms).
During Q4, the Puna Geothermal Power Plant resumed operation as well as partial generation, two and a half years after the eruption of the Kilauea Volcano disrupted operations. It continues the field development work as well as anticipates to increase the current 13 MW capacity to the full operation by mid-2021.
Besides, the company has completed the acquisition of shovel-ready energy storage asset in Upton County, Texas. The company possesses rich liquidity position as its cash and cash equivalents stood at $448.25 million as at 31 December 2020. This could further help ORA in tapping growth opportunities going ahead.
Further, the company has robust growth plan in place which aims at tremendously boosting its solar along with geothermal capacity. It also aims to fast-track its storage capacity in order to become a leading player in the US storage space. It plans to achieve a portfolio target of 1,455 MW – 1,575 MW by YE-2023. Therefore, we have assigned a slight premium to EV/Sales Multiple (NTM) (Peer Average). For this purpose, we have taken peers like AES Corp (AES.N), Atlantic Power Corp (AT.N), 'Clearway Energy Inc (CWENa.N), to name a few.
Considering the robust growth plans, solid liquidity position as well as decent outlook, we give a “Buy” recommendation on the stock at the current market price of $75.16 per share, down by 1.65% on 12th April 2021.
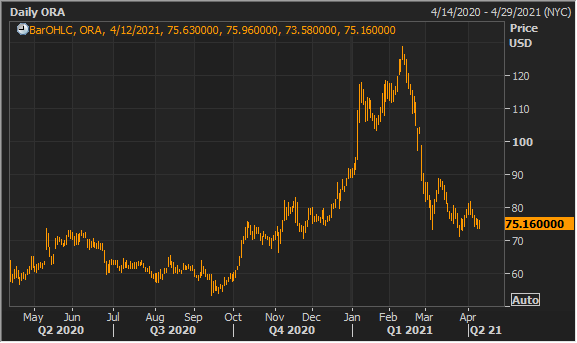
ORA Daily Technical Chart (Source: Refinitiv (Thomson Reuters))
Note: Investment decision should be made depending on the investors’ appetite on upside potential, risks, holding duration, and any previous holdings. Investors can consider exiting from the stock if the Target Price mentioned as per the Valuation has been achieved and subject to the factors discussed above.
Disclaimer - This report has been issued by Kalkine Pty Limited (ABN 34 154 808 312) (Australian financial services licence number 425376) (“Kalkine”) and prepared by Kalkine and its related bodies corporate authorised to provide general financial product advice. Kalkine.com.au and associated pages are published by Kalkine.
Any advice provided in this report is general advice only and does not take into account your objectives, financial situation or needs. You should therefore consider whether the advice is appropriate to your objectives, financial situation and needs before acting upon it.
There may be a Product Disclosure Statement, Information Statement or other offer document for the securities or other financial products referred to in Kalkine reports. You should obtain a copy of the relevant Product Disclosure Statement, Information Statement or offer document and consider the statement or document before making any decision about whether to acquire the security or product.
You should also seek advice from a financial adviser, stockbroker or other professional (including taxation and legal advice) as necessary before acting on any advice in this report or on the Kalkine website. Not all investments are appropriate for all people.
The information in this report and on the Kalkine website has been prepared from a wide variety of sources, which Kalkine, to the best of its knowledge and belief, considers accurate. Kalkine has made every effort to ensure the reliability of information contained in its reports, newsletters and websites. All information represents our views at the date of publication and may change without notice.
Kalkine does not guarantee the performance of, or returns on, any investment. To the extent permitted by law, Kalkine excludes all liability for any loss or damage arising from the use of this report, the Kalkine website and any information published on the Kalkine website (including any indirect or consequential loss, any data loss or data corruption). If the law prohibits this exclusion, Kalkine hereby limits its liability, to the extent permitted by law, to the resupply of services.
Please also read our Terms & Conditions and Financial Services Guide for further information.
On the date of publishing this report (referred to on the Kalkine website), employees and/or associates of Kalkine do not hold interests in any of the securities or other financial products covered on the Kalkine website.
 AU
AU
.jpg)
 Please wait processing your request...