Lockheed Martin Corporation (NYSE: LMT) is a global aerospace and defense company specializing in the development, manufacturing, and sustainment of advanced technology systems and defense solutions. The company operates through four business segments: Aeronautics, which focuses on military aircraft programs; Missiles and Fire Control, which provides missile defense systems, tactical weapons, and energy solutions; Rotary and Mission Systems, which delivers military helicopters, naval systems, radar, and mission technologies; and Space, which develops satellites, space transportation platforms, and strategic defense systems. The company primarily serves government and defense customers worldwide through its broad portfolio of aerospace, security, and mission-critical technologies.

Key Growth Catalysts:
Robust Defense Demand Supports Revenue Stability: Lockheed Martin reported Q1FY26 sales of USD 18.0 billion, broadly stable compared with USD 17.96 billion in Q1FY25, reflecting sustained demand across key defense and space programs. Strong growth in the Missiles & Fire Control and Space businesses helped offset softer trends in Aeronautics and Rotary & Mission Systems. The company also maintained a substantial backlog of USD 186.4 billion, providing long-term revenue visibility across major defense platforms and missile systems.
Missile Production Expansion Enhances Long-Term Growth Visibility: The company announced multiyear framework agreements with the U.S. government aimed at significantly expanding missile production capacity, including PAC-3, THAAD, and Precision Strike Missile systems. Management indicated that production rates for these systems are expected to increase by three to four times current levels, supported by USD 8–9 billion of investments through 2030, including USD 2–3 billion in capital expenditures. These initiatives are expected to strengthen supply-chain capabilities, improve manufacturing efficiency, and support mid-teens five-year sales CAGR expectations for the Missiles & Fire Control segment.
Missiles & Fire Control Segment Continues Strong Momentum: The Missiles & Fire Control (MFC) business remained a key growth driver during Q1FY26, with sales increasing 8% YoY to USD 3.65 billion and operating profit rising 8% to USD 500 million. Growth was supported by production ramp-up across integrated air and missile defense programs, including PAC-3, as well as tactical and strike missile platforms such as JASSM, LRASM, and PrSM. The segment’s resilient margin profile highlights favorable program mix and strong defense spending trends globally.
Operational and Strategic Developments
- Space Programs and Artemis Mission Reinforce Technological Leadership: Lockheed Martin demonstrated continued leadership in advanced space systems through the successful completion of NASA’s historic Artemis II mission, where the Orion spacecraft safely completed its lunar mission and re-entry operations. The Space segment also reported 7% YoY sales growth to USD 3.43 billion, driven by higher activity in Fleet Ballistic Missile (FBM) and Next Generation Interceptor (NGI) programs. These programs reinforce the company’s strategic positioning in national security and deep-space exploration initiatives.
- F-35 Sustainment Demand Continues to Support Aeronautics Business: Although Aeronautics segment sales declined marginally by 1% YoY to USD 6.95 billion, higher F-35 sustainment activity partially offset lower classified program and F-16 volumes. The company also reported favorable profit adjustments on the F-35 program, demonstrating ongoing operational execution strength in one of the world’s most important defense aviation platforms. Continued global adoption and sustainment demand for the F-35 platform could support recurring long-term revenues for the business.
Reaffirmed FY26 Guidance Reflects Management Confidence: Management reaffirmed its FY26 outlook, projecting sales between USD 77.5 billion and USD 80.0 billion alongside diluted EPS guidance of USD 29.35–30.25. The company also expects free cash flow between USD 6.5 billion and USD 6.8 billion for FY26 despite temporary working capital pressure during Q1FY26. Guidance reaffirmation highlights management’s confidence in operational execution, production ramp-up plans, and sustained government demand trends across defense and aerospace markets.
Continued Investment in Innovation and Infrastructure Supports Competitive Position: Lockheed Martin continued investing aggressively in future growth initiatives during Q1FY26, with capital expenditures of USD 511 million and research & development spending of USD 458 million. The company is also expanding manufacturing capacity through the development and modernization of more than 20 facilities across multiple states while investing in workforce development initiatives. These investments are expected to strengthen the company’s competitive positioning in next-generation defense technologies, missile systems, and autonomous capabilities.
Key Risks:
- Program Execution Challenges: Development delays and unfavorable profit adjustments in programs such as F-16, C-130, CH-53K, and Seahawk could continue pressuring margins and operational performance.
- Government Budget Dependence: The company remains highly dependent on U.S. government defense budgets, procurement priorities, and contract awards.
- Working Capital and Cash Flow Volatility: Higher working capital requirements and billing timing differences could create near-term free cash flow fluctuations.
- Supply Chain and Production Risks: Expanding missile production capacity may face risks related to labor availability, supply-chain constraints, and manufacturing execution
-
Technical Observation (on the daily chart):
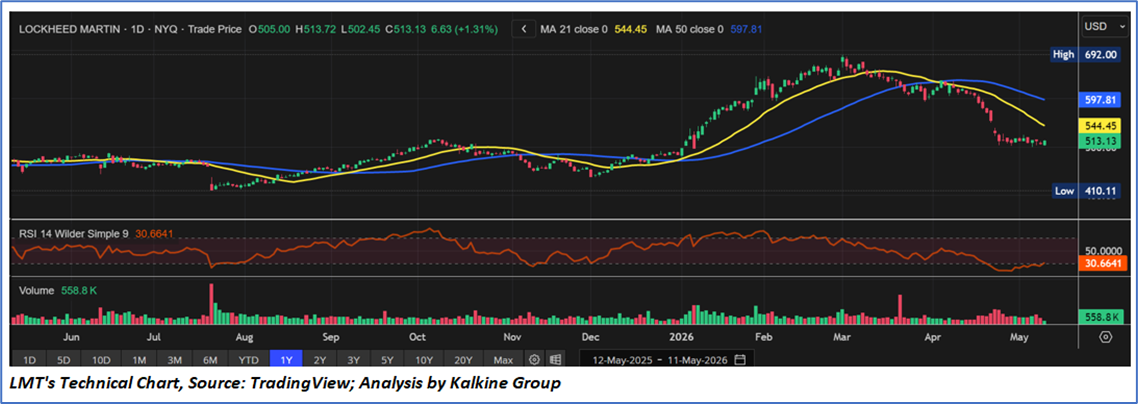
- Lockheed Martin’s stock remains under pressure after witnessing a sharp correction from the recent peak near the USD 690 level, indicating a strong medium-term bearish trend.
- The stock is currently trading below both the 21-day moving average (USD 544.45) and the 50-day moving average (USD 597.81), reflecting continued weakness in price momentum and confirming negative trend alignment.
- The 21-day moving average has also crossed below the 50-day moving average, suggesting bearish momentum remains dominant despite the recent stabilization attempt.
- RSI (14) is currently near 30.7, hovering close to oversold territory, which indicates selling pressure may be easing and the stock could attempt a short-term technical rebound.
- Price action over recent sessions shows consolidation around the USD 500–515 zone, suggesting the stock may be trying to establish a near-term support base after the steep decline.
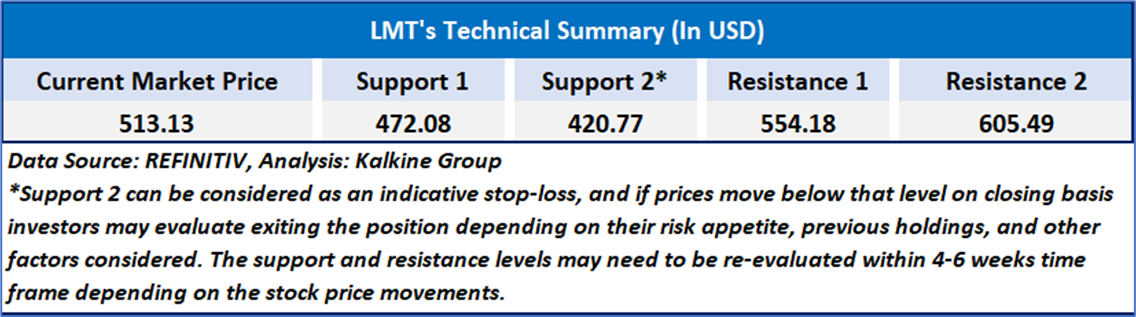
- Immediate resistance is visible near the 21-day moving average around USD 544, while stronger resistance remains near the 50-day moving average around USD 598. A sustained move above these levels would be required to improve the broader technical outlook.
- On the downside, support appears near the USD 500 psychological level, followed by the broader support region around USD 470–480. A breakdown below these levels could trigger additional weakness.
- Volume activity increased notably during the recent decline phase, indicating strong distribution pressure; however, declining volatility during the current consolidation phase may suggest selling intensity is moderating.
Lockheed Martin delivered a resilient Q1FY26 performance supported by strong missile defense demand, stable consolidated revenues, and significant long-term production expansion initiatives. The company’s growing exposure to missile defense systems, large backlog, leadership in advanced aerospace and space technologies, and reaffirmed FY26 guidance collectively strengthen its long-term growth visibility despite temporary margin and cash flow pressures in certain segments.
As per the above-mentioned price action, recent key business and financial updates, momentum in the stock over the last month, and technical indicators analysis, a ‘Buy’ rating has been given Lockheed Martin Corporation (NYSE: LMT) at the current market price of USD 513.13, as of May 11,2026 at 10:20 am PDT.
Individuals can evaluate the stock based on the support and resistance levels provided in the report in case of keen interest taking into consideration the risk-reward scenario.
Markets are trading in a highly volatile zone currently due to certain macro-economic issues and prevailing geopolitical tensions. Therefore, it is prudent to follow a cautious approach while investing.
Related Risk: This report may be looked at from a high-risk perspective and a recommendation is provided for a short duration. This report is solely based on technical parameters, and the fundamental performance of the stocks has not been considered in the decision-making process. Other factors which could impact the stock prices include market risks, regulatory risks, interest rates risks, currency risks, social and political instability risks etc.
Note 1: Past performance is not a reliable indicator of future performance.
Note 2: The reference date for all price data, currency, technical indicators, support, and resistance level is May 11,2026. The reference data in this report has been partly sourced from REFINITIV.
Note 3: Investment decisions should be made depending on an individual's appetite for upside potential, risks, holding duration, and any previous holdings. An 'Exit' from the stock can be considered if the Target Price mentioned as per the Valuation and or the technical levels provided has been achieved and is subject to the factors discussed above.
Note 4: Target Price refers to a price level that the stock is expected to reach as per the relative valuation method and or technical analysis taking into consideration both short-term and long-term scenarios.
Note 5: ‘Kalkine reports are prepared based on the stock prices captured either from the New York Stock Exchange (NYSE), NASDAQ Capital Markets (NASDAQ), and or REFINITIV. Typically, all sources (NYSE, NASDAQ, or REFINITIV) may reflect stock prices with a delay which could be a lag of 15-20 minutes. There can be no assurance that future results or events will be consistent with the information provided in the report. The information is subject to change without any prior notice.

 CA
 NZ
 UK
 US
 IND

 AU

 Please wait processing your request...