SolarEdge Technologies, Inc.
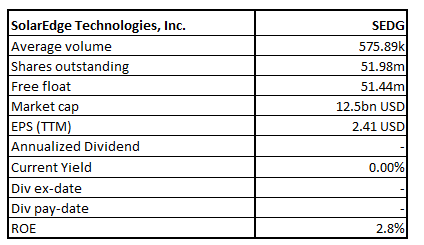
SEDG Details
SolarEdge Technologies, Inc. (NASDAQ: SEDG) is a top player in smart energy technology. It offers energy solutions for residential, commercial and large-scale PV systems. Its product offerings include energy storage systems (ESS), and backup, electric vehicle (EV) components and charging capabilities, home energy management, grid services, power plants, lithium-ion batteries and uninterrupted power supply (UPS).
Q1FY21 Results Performance (For the Quarter Ended 31 March 2021)
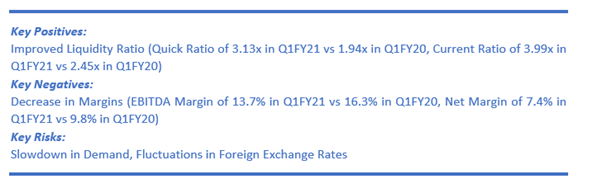
Rise in Revenue Sequentially: SEDG has recorded a 13% QoQ growth in revenues to $405.5 million as against $358.1 million in the prior quarter. However, the revenues for the quarter declined by 6% YoY.
Net Income Rose 70% QoQ: In GAAP terms, the net income increased by 70% QoQ to $30.1 million, while it was down by 29% YoY. Under non-GAAP, the net income largely remained flat at $55.5 million as compared to $55.7 million in the prior quarter. However, it grew by 10% YoY.
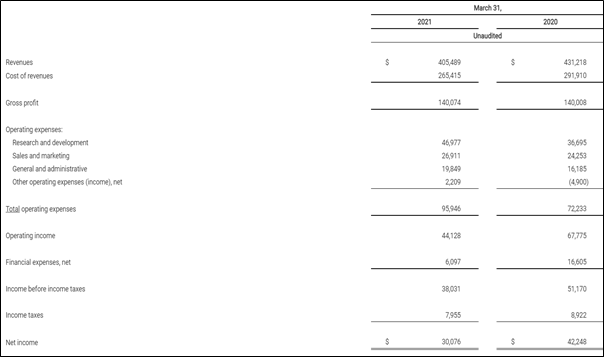
Consolidated Condensed Income Statement (Figures in Thousands) (Source: Company Reports)
Appointment of New Director
The company, on 19 April 2021, declared the induction of Ms. Betsy Atkins to the board of directors effective June 1, 2021. She has a rich experience of leadership and extensive board skill and has an immense global perspective.
Key Risks
Investors should keep an eye on related risks like the rapidly evolving and competitive nature of the solar industry and sustained pressure on gross margin. Further, the company’s performance is susceptible to a reduction in retail prices of electricity from the utility grid, or other renewable energy resources as well as a drop in demand for solar energy solutions, tightening of interest rates, or debt financing, among others.
Outlook
The company continued to witness growth in its solar business across geographies and segments. Driven by its operational performance in Q1FY21, it expects to meet the sustained rise in demand for its residential and commercial products worldwide. Meanwhile, SEDG has guided its revenue in Q2FY21 to stay in between $445 million to $465 million with revenues from solar products to remain in the range of $405 million to $420 million. Further, it has guided its gross margin in Non-GAAP terms to remain between 32% to 34% and Non- GAAP gross margin from the sale of solar products to be in the range of 36% - 38%.
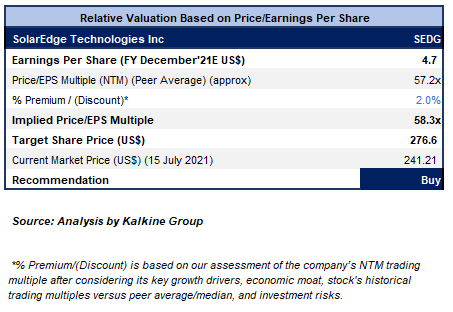
Valuation Methodology: Price/Earnings Per Share Based Relative Valuation (Illustrative)
Stock Recommendation
We have valued the stock using Price/Earnings Per Share multiple-based illustrative relative valuation and have arrived at a target price that reflects a rise of low double-digit (in % terms). We have assigned a slight premium to Price/Earnings Per Share Multiple (NTM) (Peer Average) considering its sustained growth in its solar business across geographies and segments, healthy liquidity position and decent outlook. For the purposes of relative valuation, we have taken peers like CEVA Inc (CEVA.OQ), SunPower Corp (SPWR.OQ), Enphase Energy Inc (ENPH.OQ), to name a few. As per NASDAQ, the stock has made a 52-week low and high of $162.60 and $377.00, respectively.
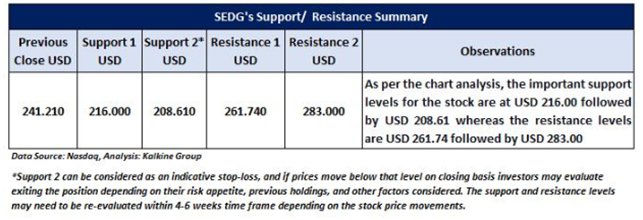
Considering the aforementioned factors, we give a “Buy” recommendation on the stock at the current market price of $241.21 per share, down by 1.73% on 15th July 2021.
Technical Chart:
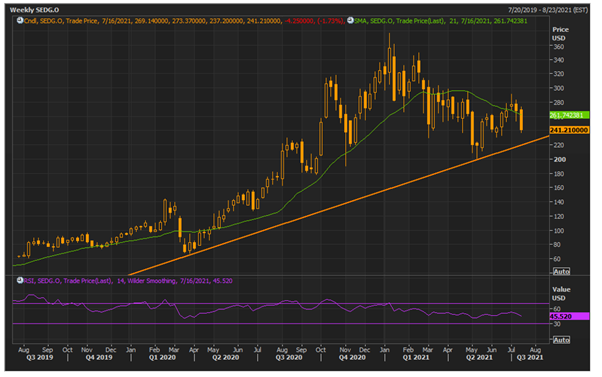
Source: REFINITIV
Sunrun Inc.
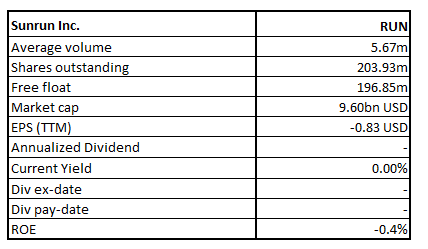
RUN Details
Sunrun Inc. (NASDAQ: RUN) is the top solar company player in the U.S with an entire focus on residential solar systems. It provides home solar, battery storage, and energy services to its customers present across 175 cities in 22 states and Puerto Rico.
Q1FY21 Results Performance (For the Period Ended 31 March 2021)
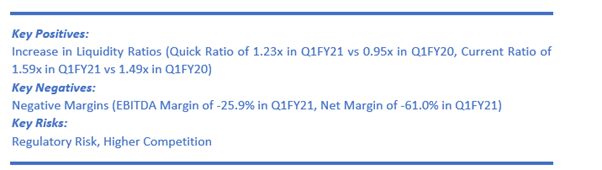
Solid Revenue growth of 59% YoY: RUN has logged a strong revenue growth of 59% YoY to $334.8 million with revenue from customer agreements and incentives as well as solar energy systems and product sales for the quarter growing by 76% and 44%, respectively. Net subscriber value stood at $8,197 in Q1FY21, ensuing in the generation of a total value of $165 million during Q1FY21.
Customer Additions: Customer additions remained healthy as it added 23,556 customers, including 20,087 subscriber additions that took its customer base to 573,634 as of March 31, 2021.
Increase in Net Loss: Total operating expenses increased significantly by 88% YoY to $513.3 million. Resultantly, net loss attributable to common stockholders increased to $23.8 million.
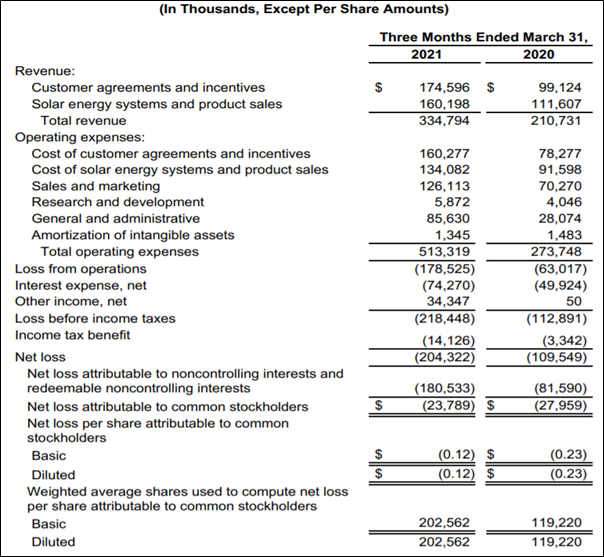
Consolidated Income Statement (Source: Company Reports)
Partnering with Ford
The company, on 19 May 2021, declared that it formed a partnership with Ford Motor Company to assist in the installation of the 80-amp Ford Charge Station Pro and Home integration system for the all-electric F-150 Lightning.
Outlook
The management raised its growth guidance in solar energy capacity installed to 25% to 30% from its earlier prediction of 20-25% growth for 2021 owing to the effect of execution, benefits of scale, differentiated service offering, and competitive position.
Additionally, it now expects to achieve a total value generated of over $750 million in 2021 against its earlier guidance of $700 million. Besides, it reiterated garnering cost synergies of $120 million run-rate by the end of 2021.
Key Risks
The company’s operations are exposed to risks of supply chain disruptions caused by the outbreak of the pandemic or other natural calamities. Also, the company faces competition from the traditional energy companies as well as solar and other renewable energy companies.
Valuation Methodology: EV/Sales Based Relative Valuation (Illustrative)
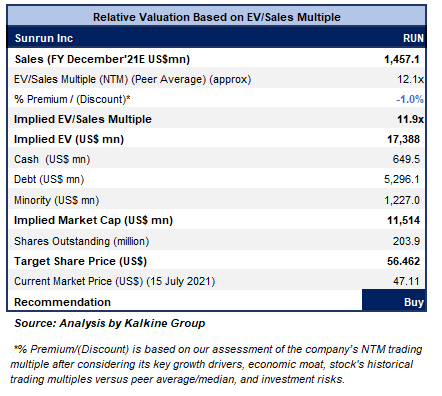
Stock Recommendation
We have valued the stock using an EV/Sales multiple-based illustrative relative valuation and have arrived at a target price that reflects a rise of low double-digit (in % terms). We have applied a slight discount to EV/Sales Multiple (NTM) (Peer Average) considering its higher operating costs, negative earnings in Q1FY21 as well as higher debt levels.
For the purposes of relative valuation, we have taken peers like Vicor Corp (VICR.OQ), Beam Global (BEEM.OQ), among others. As per NASDAQ, the stock has made a 52-week low and high of $34.18 and $100.93, respectively.
Considering its upgrade in guidance along with expanding market reach, healthy liquidity position, and decent growth outlook, we give a “Buy” recommendation on the stock at the current market price of US$47.11 per share, down by 3.26% on 15th July 2021.
Technical Chart:
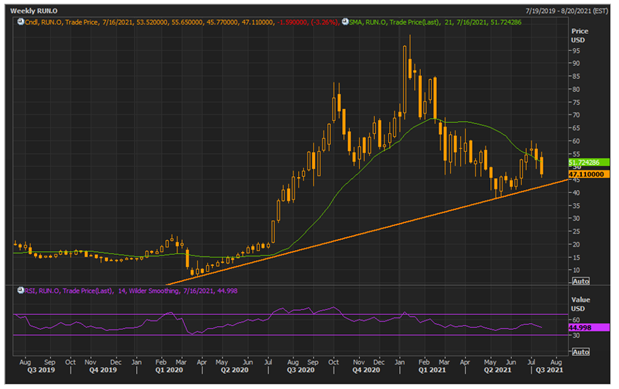
Source: REFINITIV
Note 1: The reference data in this report has been partly sourced from REFINITIV.
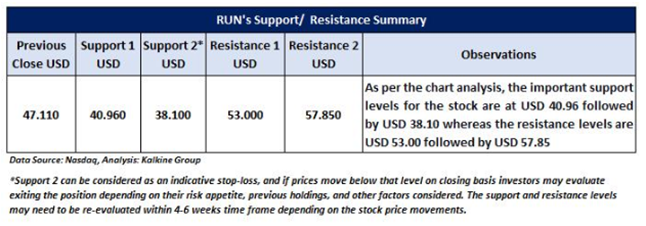
Note 2: Investment decisions should be made depending on the investors’ appetite on upside potential, risks, holding duration, and any previous holdings. Investors can consider exiting from the stock if the Target Price mentioned as per the analysis has been achieved and subject to the factors discussed above alongside support levels provided.
Technical Indicators Defined:-
Support: A level where-in the stock prices tend to find support if they are falling, and downtrend may take a pause backed by demand or buying interest.
Resistance: A level where-in the stock prices tend to find resistance when they are rising, and uptrend may take a pause due to profit booking or selling interest.
Stop-loss: It is a level to protect further losses in case of unfavourable movement in the stock prices
Disclaimer - This report has been issued by Kalkine Pty Limited (ABN 34 154 808 312) (Australian financial services licence number 425376) (“Kalkine”) and prepared by Kalkine and its related bodies corporate authorised to provide general financial product advice. Kalkine.com.au and associated pages are published by Kalkine.
Any advice provided in this report is general advice only and does not take into account your objectives, financial situation or needs. You should therefore consider whether the advice is appropriate to your objectives, financial situation and needs before acting upon it.
There may be a Product Disclosure Statement, Information Statement or other offer document for the securities or other financial products referred to in Kalkine reports. You should obtain a copy of the relevant Product Disclosure Statement, Information Statement or offer document and consider the statement or document before making any decision about whether to acquire the security or product.
You should also seek advice from a financial adviser, stockbroker or other professional (including taxation and legal advice) as necessary before acting on any advice in this report or on the Kalkine website. Not all investments are appropriate for all people.
The information in this report and on the Kalkine website has been prepared from a wide variety of sources, which Kalkine, to the best of its knowledge and belief, considers accurate. Kalkine has made every effort to ensure the reliability of information contained in its reports, newsletters and websites. All information represents our views at the date of publication and may change without notice.
Kalkine does not guarantee the performance of, or returns on, any investment. To the extent permitted by law, Kalkine excludes all liability for any loss or damage arising from the use of this report, the Kalkine website and any information published on the Kalkine website (including any indirect or consequential loss, any data loss or data corruption). If the law prohibits this exclusion, Kalkine hereby limits its liability, to the extent permitted by law, to the resupply of services.
Please also read our Terms & Conditions and Financial Services Guide for further information.
On the date of publishing this report (referred to on the Kalkine website), employees and/or associates of Kalkine do not hold interests in any of the securities or other financial products covered on the Kalkine website.
 AU
AU

 Please wait processing your request...