Sprouts Farmers Market, Inc.

SFM Details
In 2002, Sprouts Farmers Market, Inc. (NASDAQ: SFM) opened the first store so that natural foods can be accessible to everyone. The company provides a unique grocery experience featuring an open layout with the fresh produce at the heart of the store.
Results Performance (14-week fourth quarter and 53-week year ended January 3, 2021)
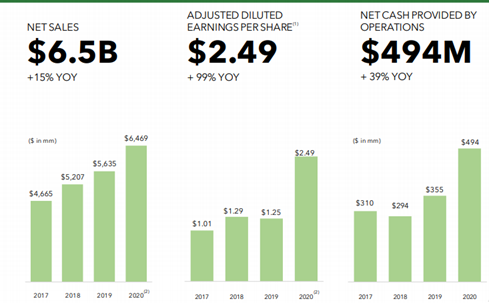
In the fourth quarter, net sales of the company stood at $1.6 billion, reflecting a 17% rise from the same period in 2019 and it witnessed comparable store sales growth of 3.7% as well as two-year comparable store sales growth of 5.2%, both on the 13-week basis. In fiscal year 2020, net sales of the company stood at $6.5 billion, implying a 15% rise from 2019. In 2020, the company managed to generate record earnings as well as cash flow from the 15% increase in sales while absorbing costs related to the 340% rise in the ecommerce sales, paying record bonuses to the frontline team members, as well as opening 22 new stores.
Key Data (Source: Company Reports)
Recent Updates
In the release dated March 4, 2021, the company made an announcement that its Board of Directors authorized the new share repurchase program on March 3, 2021 of $300 million of the common shares. It was mentioned that the new share repurchase program reflects the commitment towards robust cash flow generation as well as driving shareholder return, while at the same time, deploying capital in order to drive growth over the long term.
In the release dated March 22, 2021, the company stated that it has opened a new distribution center in Aurora, marking the first center in Colorado as well as sixth throughout the country. The 135,000 square-foot facility was built for Sprouts as well as includes 55°F and 34°F storage and fruit ripening rooms which are ideal for the variety of fresh produce that the company offers.
Outlook
It was stated that the impact which COVID-19 would be having on the U.S. economy as well as the company’s fiscal 2021 results is uncertain. Notably, adjusted EBIT is expected to be between $295 million to $315 million and adjusted EPS is anticipated to be between $1.78- $1.91.
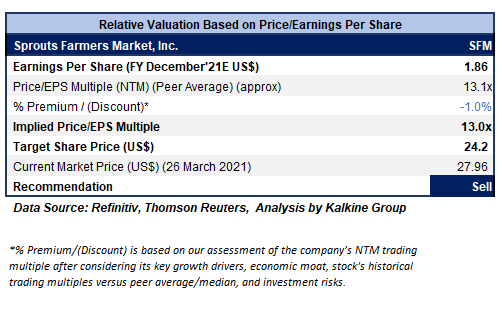
Valuation Methodology: P/E Based Relative Valuation (Illustrative)
Technical Overview:
Weekly Chart:
.png)
(Source: Refinitiv (Thomson Reuters))
Note: The purple color line in the chart depicts RSI (14-period) and the yellow color line represents trend line.
SFM stock price has given a steep rally from the low of US$18.21 made on November 2020 and recently hit a high of US$28.01 level (on 26 March 2021,) a gain of ~54 percent in five months. On the weekly chart, the SFM prices are trading in a horizontal channel formation from past almost 6 years and now prices are approaching towards the upper band of the channel formation which act as resistance zone. Furthermore, the momentum oscillator RSI (14-period) is trading at ~72 levels near to overbought territory, a correction from here may drift the price lower towards the support level. An important support level for the stock, is placed at US$23.50, while the key resistance level is placed at US$29.63.
Stock Recommendation
The company’s stock has made a 52-week low and high of $17.79 and $28.01, respectively. The company has managed to generate cash from operations amounting to $494 million in fiscal 2020 and deployed $96 million in the capital expenditures net of landlord reimbursements, mainly for new stores. During the fiscal year 2020, the company paid down $288 million of the outstanding debt.
The stock is trading near the 52-week high level which is also a multi-year high level for the stock, and, therefore, the market participants can consider booking profits in the stock.
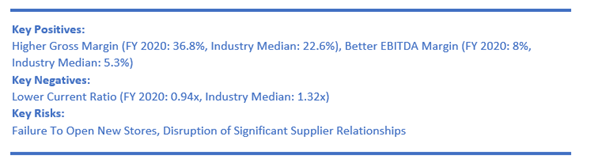
Considering the aforesaid facts, we have valued the stock using P/E multiple-based illustrative relative valuation and there are expectations that the stock price might witness a fall of low double-digit (in % terms). We believe the company can trade at a slight discount to Price/EPS Multiple (NTM) (Peer Average) driven by its lower current ratio, higher operational expenses due to COVID-19, while also taking into consideration historical discounted multiples versus peer average.
Thus, we give a “Sell” rating on the stock at the current price of US$27.96 per share, up by 6.31% on March 26, 2021.
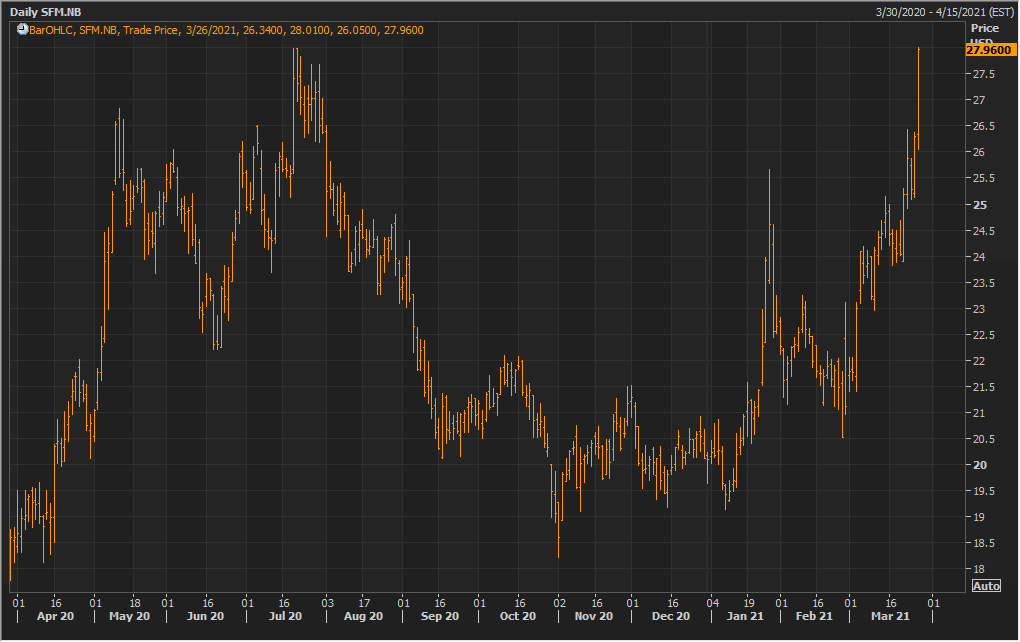
SFM Daily Technical Chart (Source: Refinitiv (Thomson Reuters))
Disclaimer - This report has been issued by Kalkine Pty Limited (ABN 34 154 808 312) (Australian financial services licence number 425376) (“Kalkine”) and prepared by Kalkine and its related bodies corporate authorised to provide general financial product advice. Kalkine.com.au and associated pages are published by Kalkine.
Any advice provided in this report is general advice only and does not take into account your objectives, financial situation or needs. You should therefore consider whether the advice is appropriate to your objectives, financial situation and needs before acting upon it.
There may be a Product Disclosure Statement, Information Statement or other offer document for the securities or other financial products referred to in Kalkine reports. You should obtain a copy of the relevant Product Disclosure Statement, Information Statement or offer document and consider the statement or document before making any decision about whether to acquire the security or product.
You should also seek advice from a financial adviser, stockbroker or other professional (including taxation and legal advice) as necessary before acting on any advice in this report or on the Kalkine website. Not all investments are appropriate for all people.
The information in this report and on the Kalkine website has been prepared from a wide variety of sources, which Kalkine, to the best of its knowledge and belief, considers accurate. Kalkine has made every effort to ensure the reliability of information contained in its reports, newsletters and websites. All information represents our views at the date of publication and may change without notice.
Kalkine does not guarantee the performance of, or returns on, any investment. To the extent permitted by law, Kalkine excludes all liability for any loss or damage arising from the use of this report, the Kalkine website and any information published on the Kalkine website (including any indirect or consequential loss, any data loss or data corruption). If the law prohibits this exclusion, Kalkine hereby limits its liability, to the extent permitted by law, to the resupply of services.
Please also read our Terms & Conditions and Financial Services Guide for further information.
On the date of publishing this report (referred to on the Kalkine website), employees and/or associates of Kalkine do not hold interests in any of the securities or other financial products covered on the Kalkine website.
 AU
AU

 Please wait processing your request...