JinkoSolar Holdings Co Ltd

JKS Details
JinkoSolar (NYSE: JKS) is a global leader in the solar industry and it is engaged in distributing its solar products and sells its solutions and services to a diversified international utility, commercial and residential customer base in China, the United States, Japan, Germany, the United Kingdom, Chile, South Africa, India, Mexico, Brazil, the United Arab Emirates, Italy, Spain, France, Belgium, and other countries and regions. The company has a market capitalization of ~$1.44 billion as on May 10, 2021.

Results Performance (Year Ended 31 December 2020)
The company’s revenue increased by 18.1% from RMB29.75 billion in 2019 to RMB35.13 billion (US$5.38 billion) in 2020, primarily due to the increase in shipments of solar modules, which was partially offset by a decline in the average selling price of solar modules. Its gross profit increased by 13.6% from RMB5.43 billion in 2019 to RMB6.17 billion (US$945.8 million). Its operating expenses increased by 18.6% from RMB3.70 billion in 2019 to RMB4.39 billion (US$672.3 million) in 2020. Its net income attributable to JinkoSolar Holding Co., Ltd. decreased from RMB898.7 million in 2019 to RMB230.4 million (US$35.3 million) in 2020.

Key Data (Source: Company Reports)
Outlook:
The move to implement policies of de-carbonization by the major economies like the USA, Europe and China provide for strong future solar demand. In the United States, solar demand is expected to be more than double over the next five years under the Biden administration, with major commitments to climate change including plans for the United States to rejoin the Paris Agreement, extension of 30% solar ITC for five years, and to achieve net zero emissions by 2050. The European Union has officially announced plans to increase the greenhouse gases reduction target from 40% to at least 60% below 1990 levels by 2030. China outlined strategic plans to hit peak emissions before 2030 and reach carbon neutrality by 2060. Thus, solar power is expected to play a vital role in accelerating the transformation of electric generation and consumption and demand for PV will experience rapid growth.
JKS with its presence across all major economies is well-positioned to capitalize on emerging opportunities with the fast implementation of de-carbonization.
Key Risks:
The company’s future growth and profitability depend on the demand for and the prices of solar power products and the development of photovoltaic technologies. The reduction, modification, delay or elimination of government subsidies and other economic incentives in the solar energy industry may reduce the profitability of the business.
Valuation Methodology: EV/EBITDA Multiple Based Relative Valuation (Illustrative)

Technical Overview:
Weekly Chart –

Source: Refinitiv (Thomson Reuters)
Note: Purple colour lines are Bollinger Bands® with the upper band suggesting overbought status while the lower band oversold status, and yellow lines are Fibonacci retracement lines which measure price rebound and backtrack. https://www.bollingerbands.com/
The stock has corrected beyond a 61.8% retracement level of $42.80 from its high around $90.00. For the ongoing week, it has given a weaker close around $30.26. The technical indicator RSI with a reading around 38 and a curve at the end pointing down, suggests weaker trend for the stock.
Going forward, the stock may have resistance around the 61.8% retracement level of $42.80 whereas support could be around the lower Bollinger band of $25.55.
Stock Recommendation:
The company successfully maintained stable margin performance despite the recent shortage of major raw materials supply arising out from stringent cost control and resilient supply management.
We have valued the stock using an EV/EBITDA multiple-based illustrative relative valuation and have arrived at a target price which reflects a rise of low double-digit (in % terms). We have applied a slight discount to EV/EBITDA Multiple (NTM) (Peer Average) considering higher total debt. The stock rose by ~91.2% in 1 year and by ~43.6% in 9 months. It has made a 52-week low and high of $13.68 and $90.2, respectively.
Considering the aforesaid facts, we give a “Buy” recommendation on the stock at the current market price of $30.26 per share, down by 6.63% on May 10, 2021.
Note: Investment decisions should be made depending on the investors’ appetite on upside potential, risks, holding duration, and any previous holdings. Investors can consider exiting from the stock if the Target Price mentioned as per the Valuation has been achieved and subject to the factors discussed above.
Array Technologies, Inc.
ARRY Details
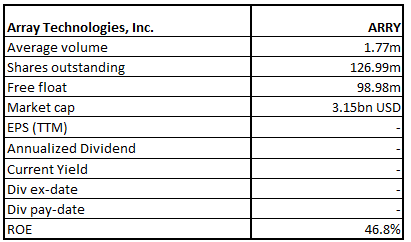
Array Technologies Inc (NASDAQ: ARRY) is headquartered in the United States and has offices in Europe, Central America and Australia. It manufactures ground-mounted systems which is used in solar energy projects. The company has a focus on innovation and follows a customer-centric approach. The company has a market capitalization of ~$3.15 billion as on May 10, 2021.

Results Performance (Year Ended 31 December 2020)
The company’s revenue increased by 35% to $873 million, as compared to the previous year. The result can be attributed to the growing demand for solar energy, underpinned by the fact that more than 1 in every 4 solar modules installed to date is on Array product. Adjusted EBITDA for the period stood at $161 million, an increase of 32% on the previous year. Net income for the period stood at $59 million, an increase of 49% on the previous year.

Key Metrics (Source: Company Reports)
Recent update:
Recently, on 26 April 2021, the company informed the market that it has been awarded a contract for up to 4GW of trackers from Primoris Services Corporation (NASDAQ: PRIM) ( a leading provider of specialty contracting services), which includes a commitment to purchase 2.5GW of DuraTrack® HZ v3 single-axis solar trackers that are scheduled to be used in more than 10 projects across North America and an option to purchase an additional 1.5GW for other projects.
Outlook:
The company has a strong pipeline of orders. It added 38 new clients with 8 servicing the international market, during 2020. It has also acquired a technology company that has the potential to significantly reduce the cost of installing trackers. The U.S. policy support such as likely extension of renewable energy tax credits for five years (e.g. GREEN Act, CLEAN Future Act), restoration of Obama Clean Power plan and legislation on National Clean Energy to reach zero-carbon electricity industry by 2035, will drive demand for solar power products, thereby, Arry’s products.
Key Risks:
The reduction, modification, delay or elimination of government subsidies and other economic incentives for the solar energy industry may reduce the profitability of the business.
Valuation Methodology: EV/EBITDA Multiple Based Relative Valuation (Illustrative)

Technical Overview:
Weekly Chart –

Source: Refinitiv (Thomson Reuters)
Note: Purple colour lines are Bollinger Bands® with the upper band suggesting overbought status while the lower band oversold status, and yellow lines are Fibonacci retracement lines which measure price rebound and backtrack. https://www.bollingerbands.com/
The stock has given a softer close for the ongoing week at $24.88, forming a ‘Bullish Doji Star’. The technical Indicator RSI with a reading around 39 and a flattish curve at the end suggests flat to neutral momentum for the stock.
Going forward, the stock may have resistance around a 23.6% retracement level of $30.95 whereas support could be around the previous low of $23.58.
Stock Recommendation:
The company’s EBITDA margin and net margin for FY20 stood at 17.1% and 6.0%, better than the industry median of 14.7% and 4.6%, respectively implying greater efficiency in managing costs by the company. ROE for FY20 stood at 46.8%, better than the industry median of 6.4%, implying that the company generated a better return for the shareholders than the peer group.
We have valued the stock using an EV/EBITDA multiple-based illustrative relative valuation and have arrived at a target price which reflects a rise of low double-digit (in % terms). We have applied a slight premium to EV/EBITDA Multiple (NTM) (Peer Average) considering the strong pipeline of orders and higher ROE.
Considering the aforesaid facts, we give a “Buy” recommendation on the stock at the current market price of $24.88 per share, down by 1.89% on May 10, 2021.
Note: Investment decisions should be made depending on the investors’ appetite on upside potential, risks, holding duration, and any previous holdings. Investors can consider exiting from the stock if the Target Price mentioned as per the Valuation has been achieved and subject to the factors discussed above.
Disclaimer - This report has been issued by Kalkine Pty Limited (ABN 34 154 808 312) (Australian financial services licence number 425376) (“Kalkine”) and prepared by Kalkine and its related bodies corporate authorised to provide general financial product advice. Kalkine.com.au and associated pages are published by Kalkine.
Any advice provided in this report is general advice only and does not take into account your objectives, financial situation or needs. You should therefore consider whether the advice is appropriate to your objectives, financial situation and needs before acting upon it.
There may be a Product Disclosure Statement, Information Statement or other offer document for the securities or other financial products referred to in Kalkine reports. You should obtain a copy of the relevant Product Disclosure Statement, Information Statement or offer document and consider the statement or document before making any decision about whether to acquire the security or product.
You should also seek advice from a financial adviser, stockbroker or other professional (including taxation and legal advice) as necessary before acting on any advice in this report or on the Kalkine website. Not all investments are appropriate for all people.
The information in this report and on the Kalkine website has been prepared from a wide variety of sources, which Kalkine, to the best of its knowledge and belief, considers accurate. Kalkine has made every effort to ensure the reliability of information contained in its reports, newsletters and websites. All information represents our views at the date of publication and may change without notice.
Kalkine does not guarantee the performance of, or returns on, any investment. To the extent permitted by law, Kalkine excludes all liability for any loss or damage arising from the use of this report, the Kalkine website and any information published on the Kalkine website (including any indirect or consequential loss, any data loss or data corruption). If the law prohibits this exclusion, Kalkine hereby limits its liability, to the extent permitted by law, to the resupply of services.
Please also read our Terms & Conditions and Financial Services Guide for further information.
On the date of publishing this report (referred to on the Kalkine website), employees and/or associates of Kalkine do not hold interests in any of the securities or other financial products covered on the Kalkine website.
 AU
AU

 Please wait processing your request...