Shoals Technologies Group, Inc.
SHLS Details
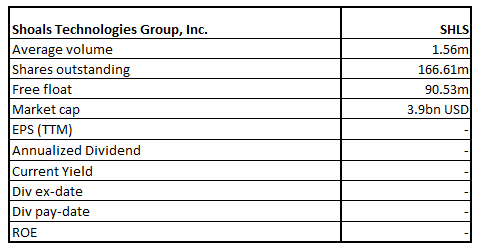
Shoals Technologies Group Inc (NASDAQ: SHLS) is a provider of electrical balance of system (EBOS) solutions for solar, battery storage, and electric vehicle charging infrastructure in the United States. The products are sold principally to engineering, procurement, and construction firms (EPCs) that build solar energy projects. The company has a market capitalization of ~$3.9 billion as on May 20, 2021.
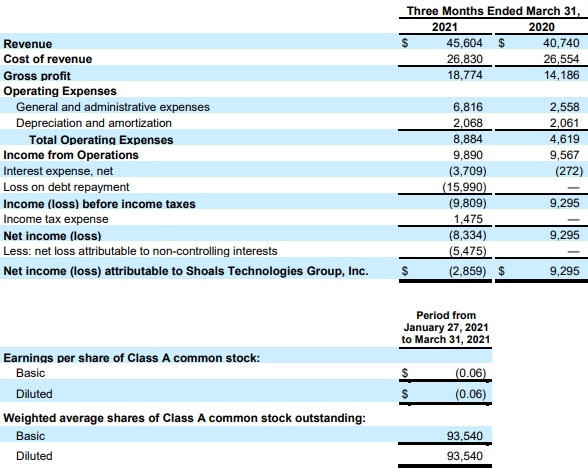
Results Performance (First Quarter Ended 31 March 2021 – Q1FY21)
Revenues of the company for Q1FY21 increased by 12% YoY to $45.6 million on $40.7 million in the previous corresponding period (pcp) on the back of a 46% YoY increase in System Solutions revenues which was partly offset by a decline in components revenues. Operating expenses for the quarter period increased by 93.5% to $8.9 million, as compared to $4.6 million in the pcp which was primarily driven by higher equity-based compensation, planned increased payroll expense due to higher headcount to support growth and product initiatives, COVID-19 related costs, new public company costs and non-recurring expenses related to the IPO. Net loss for the period stood at $8.3 million, as compared to net income of $9.3 million in the pcp. The decline in net income was primarily due to the result of a $16.0 million charge the Company recorded in the first quarter related to the early repayment of a portion of its term loan facility.
Key Data (Source: Company Reports)
Outlook:
The company continued to deliver strong financial results as is obvious from Q1FY21 results. Revenue growth of 46% YoY is particularly very encouraging which contributed 73% of revenues in the quarter against 56% in the same period last year. The company’s backlog and awarded orders increased 42% YoY to $180.6 million as on March 31, 2021. This reflects continued strong customer demand for the company’s products.
Taking into consideration the prevailing market conditions and business trends, the company has reaffirmed the previously announced outlook for the full-year ending December 31, 2021, which are as provided below:
- Revenue to be in the range of $230 million to $240 million,
- Adjusted EBITDA to be in the range of $75 million to $80 million,
- Adjusted net income to be in the range of $47 million to $51 million.
Key Risks:
The company is susceptible to weather conditions along with risk of property damage or liability stemming from errors during the building of new projects. There is also a risk of cost increases for key input factors such as labor or modules, or rate decreases for electricity generated.
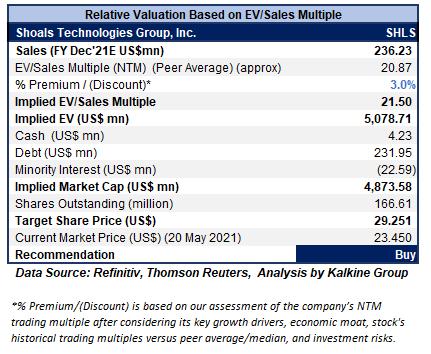
Valuation Methodology: EV/Sales Based Relative Valuation (Illustrative)
Technical Overview:
Weekly Chart –
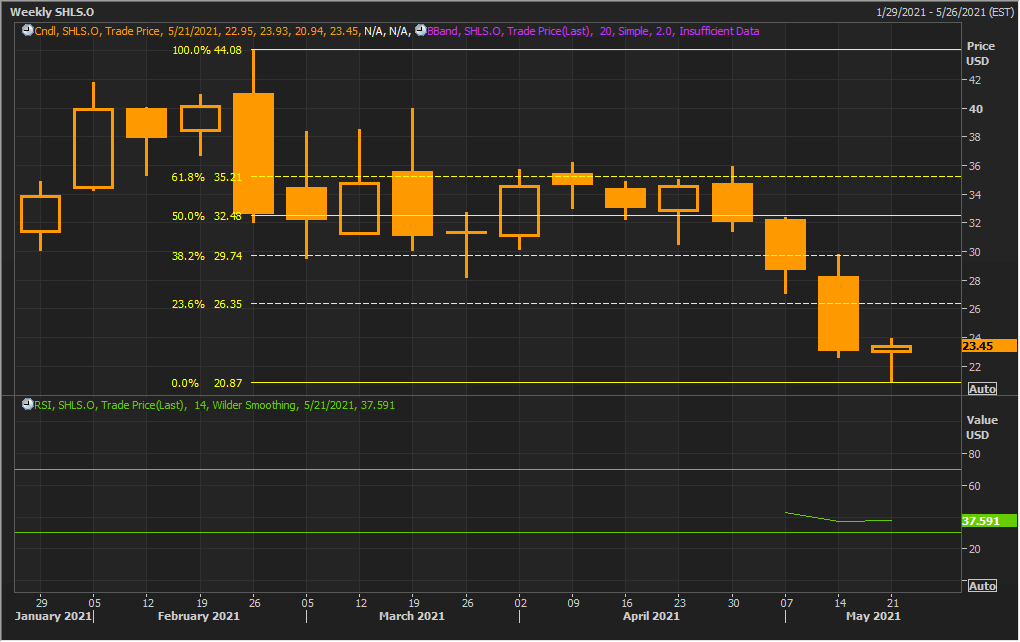
Source: Refinitiv (Thomson Reuters)
Note: Purple colour lines are Bollinger Bands® with the upper band suggesting overbought status while the lower band oversold status, and yellow lines are Fibonacci retracement lines which measure price rebound and backtrack. https://www.bollingerbands.com/
The stock has given a stronger close for the ongoing week having formed a ‘Hammer’ pattern on the chart which is towards bullish trend reversal for the stock. The technical indicator RSI with a reading around 38 and a flattish curve at the end flat to up momentum for the stock.
Going forward, the stock may have resistance around the 38.2% retracement level of $29.74 whereas support could be around the weekly low of $20.87.
Stock Recommendation:
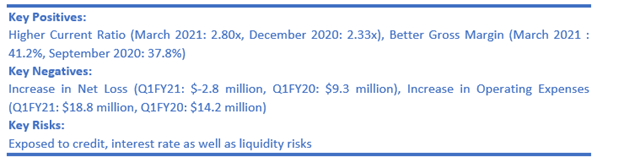
The company’s gross margin, as on 31 March 2021, stood at 41.2%, better than the gross margin of 38.3% as on 31 December 2020. Its current ratio, as on 31 March 2021, stood at 2.80x, better than the current ratio of 2.33x as on 31 December 2020.
We have applied EV/Sales based relative valuation (on an illustrative basis) and the target price reflects a rise of low double-digit (in % terms). We have applied a slight premium to EV/Sales Multiple (NTM) (Peer Average) considering better liquidity position which could help the company in navigating challenges and better gross margin.
The stock declined by ~38.5% in 3 months. It has made a 52-week low and high of 20.94 and $44.04, respectively.
Thus, we give a “Buy” recommendation on the stock at the current market price of $23.450 per share, up by 9.07% on May 20, 2021.
SunPower Corporation
SPWR Details
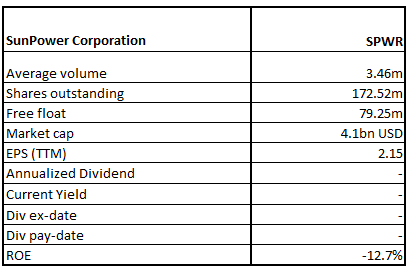
SunPower Corp (NASDAQ: SPWR) is a leading solar energy company that delivers complete solar solutions to customers through hardware, software, and financing options, and ‘Smart Energy’ solutions. The company has a market capitalization of ~$4.1 billion as on May 20, 2021.
Results Performance (Year Ended 3 January 2021 – FY20)
Revenues of the company for the full-year period increased by 3% to $1124.8 million over the previous year, primarily due to increases in revenue of the Commercial and Industrial Solutions segment. The total cost of revenue increased by 3.1% to $957.7 million over the previous year. Its gross margin stood at 15% in line with the FY19.
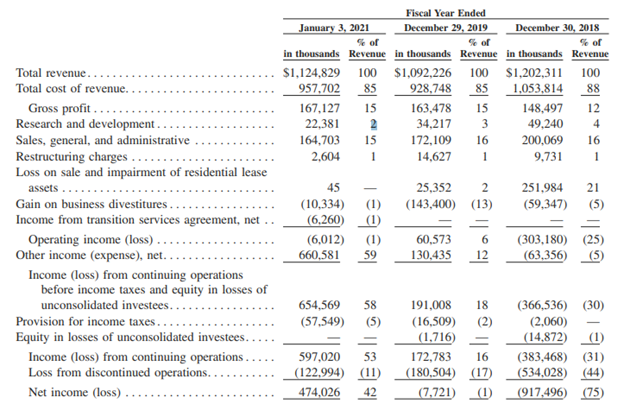
Income Statement (Source: Company Reports)
Outlook:
The company expects that the strategy will provide attractive opportunities for profitable growth over the long term. The pandemic had an adverse impact on project installation and commercial and consumer spending as well as the ability of the company’s sales channels, supply chain, and distribution. However, there has been a normalization of situations as the economy is re-opening bolstered by the lifting of restrictions and mass vaccination programme undertaken. Thus, regaining of business confidence and opportunities in the company’s core product offerings are expected to drive the sales of the company in the upcoming years.
Key Risks:
The company is exposed to a number of risks including exposure to foreign exchange, interest and credit risk, general business and economic conditions, industry trends, government policies, the impact of the ongoing pandemic, etc. that can cause actual results to differ materially.
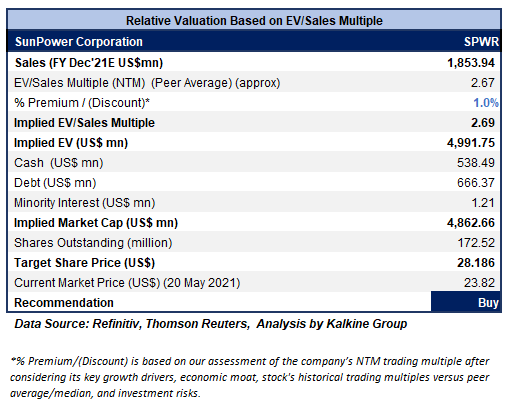
Valuation Methodology: EV/Sales Based Relative Valuation (Illustrative)
Technical Overview:
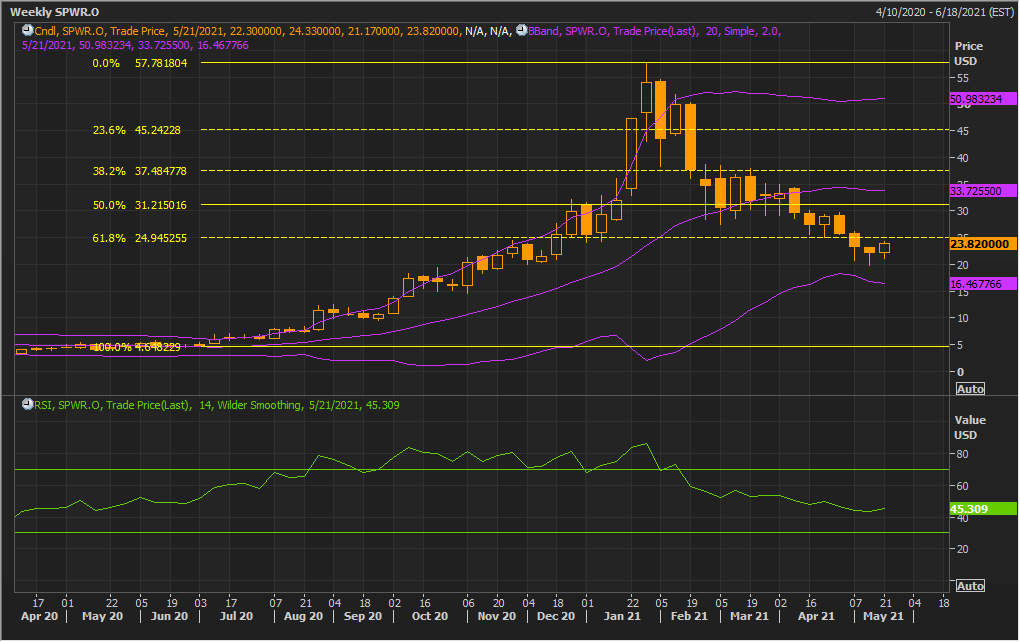
Weekly Chart –
Source: Refinitiv (Thomson Reuters)
Note: Purple colour lines are Bollinger Bands® with the upper band suggesting overbought status while the lower band oversold status, and yellow lines are Fibonacci retracement lines which measure price rebound and backtrack. https://www.bollingerbands.com/
After three consecutive weeks of selling, the stock has given a stronger closing for the ongoing week at $23.82. The chart seems to have formed a ‘Morning Star’ implying bullish reversal for the stock. The technical indicator RSI with a reading around 45 and a curve at the end pointing up, suggests gaining of bullish momentum.
Going forward, the stock may have resistance around the 50% retracement level of $31.21 whereas support could be around $20.00.
Stock Recommendation:
The company’s net margin for FY20 stood at 53.1%, better than the FY19 net margin of 16.0%. Its ROE for FY20 stood at 289.3%. Its debt-to-equity ratio declined from 96.14x in FY19 to 1.58x in FY20. The stock rose by ~13.26% in 6 months. It has made a 52-week low and high of $4.3867 and $57.5199, respectively.
We have applied EV/Sales based relative valuation (on an illustrative basis) and the target price reflects a rise of low double-digit (in % terms). We have applied a slight premium to EV/Sales Multiple (NTM) (Peer Average) considering better liquidity position which could help the company in navigating challenges and better gross margin.
Thus, we give a “Buy” recommendation on the stock at the current market price of $23.82 per share, up by 3.3% on May 20, 2021.
Note: Investment decisions should be made depending on the investors’ appetite on upside potential, risks, holding duration, and any previous holdings. Investors can consider exiting from the stock if the Target Price mentioned as per the Valuation has been achieved and subject to the factors discussed above.
Disclaimer - This report has been issued by Kalkine Pty Limited (ABN 34 154 808 312) (Australian financial services licence number 425376) (“Kalkine”) and prepared by Kalkine and its related bodies corporate authorised to provide general financial product advice. Kalkine.com.au and associated pages are published by Kalkine.
Any advice provided in this report is general advice only and does not take into account your objectives, financial situation or needs. You should therefore consider whether the advice is appropriate to your objectives, financial situation and needs before acting upon it.
There may be a Product Disclosure Statement, Information Statement or other offer document for the securities or other financial products referred to in Kalkine reports. You should obtain a copy of the relevant Product Disclosure Statement, Information Statement or offer document and consider the statement or document before making any decision about whether to acquire the security or product.
You should also seek advice from a financial adviser, stockbroker or other professional (including taxation and legal advice) as necessary before acting on any advice in this report or on the Kalkine website. Not all investments are appropriate for all people.
The information in this report and on the Kalkine website has been prepared from a wide variety of sources, which Kalkine, to the best of its knowledge and belief, considers accurate. Kalkine has made every effort to ensure the reliability of information contained in its reports, newsletters and websites. All information represents our views at the date of publication and may change without notice.
Kalkine does not guarantee the performance of, or returns on, any investment. To the extent permitted by law, Kalkine excludes all liability for any loss or damage arising from the use of this report, the Kalkine website and any information published on the Kalkine website (including any indirect or consequential loss, any data loss or data corruption). If the law prohibits this exclusion, Kalkine hereby limits its liability, to the extent permitted by law, to the resupply of services.
Please also read our Terms & Conditions and Financial Services Guide for further information.
On the date of publishing this report (referred to on the Kalkine website), employees and/or associates of Kalkine do not hold interests in any of the securities or other financial products covered on the Kalkine website.
 AU
AU

 Please wait processing your request...