Bank of America Corporation
.png)
Stock’s Details
Positive Operating Leverage Continues:Bank of America Corporation (NYSE: BAC) offers a diversified range of banking and non-bank financial services and products throughout the U.S. and in international markets. The bank operates through four business segments: Consumer Banking, Global Wealth & Investment Management (GWIM), Global Banking and Global Markets, with the remaining operations recorded in All Other. The banking activities are primarily operated under the Bank of America, National Association (Bank of America, N.A. or BANA) charter.
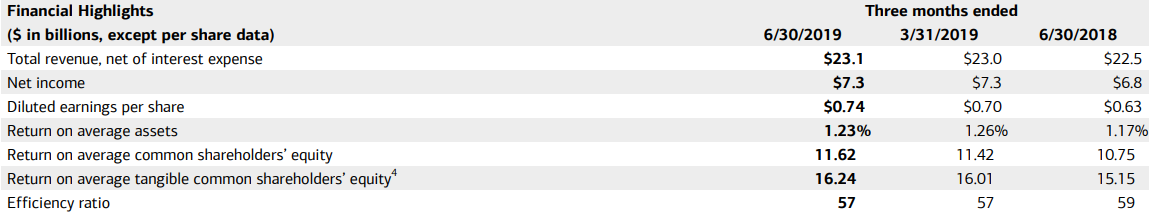
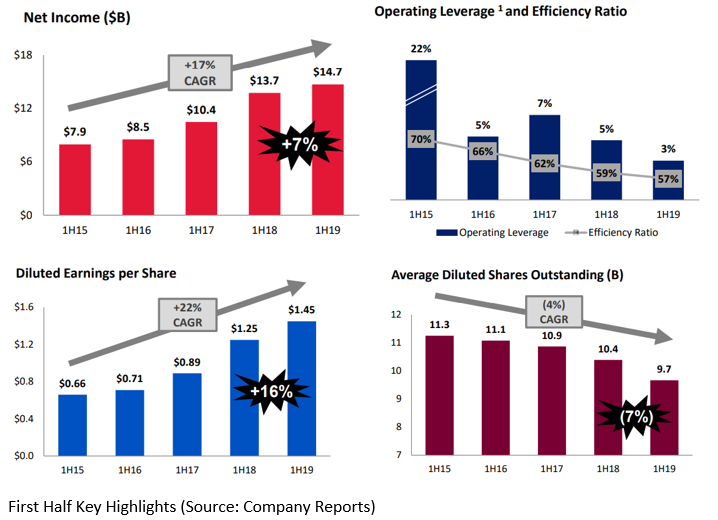
Key Highlights of 2QFY19 Results:The bank recently, announced a good set of numbers for the second quarter with record quarterly earnings of $7.3 billion and diluted EPS (earnings per share) of $0.74. Net income posted a robust growth of 8% to $7.3 billion, driven by continued positive operating leverage and strong asset quality. Revenue, net of interest expenses, stood at $23.1 billion, posted a growth of 2%. Net Interest Income (NII) grew by 3% whereas Non-Interest income saw an increase of ~2%. Provision for credit losses stood at $857 million with net charge-off ratio at 0.38%. Average loan and lease balances in business segments rose $34 billion or 4%, to $906 billion whereas average deposit balances saw an increase of $75 billion or 6%, to $1.4 trillion during the quarter. The bank repurchased $6.5 billion in common stock and paid $1.4 billion in common dividends to its shareholders.
2Q FY19 Financial Highlights (Source: Company Reports)
Segment-Wise Performance: All the segments performed well with consumer banking posting the highest net income growth of 13%.
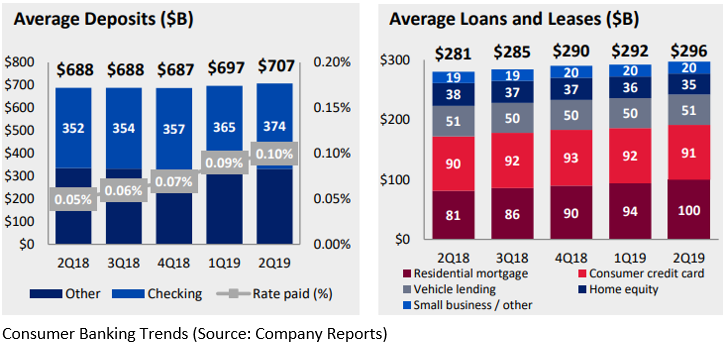
Consumer Banking: The segment witnessed an increase of 13% in net income to $3.3 billion, during the quarter. Loan and deposit growth came in at 6% and 3% to $296 billion and $707 billion, respectively. Consumer investment assets recorded an increase of 15% to $220 billion with an efficiency ratio improving to 45%.For the segment, provision for credit losses remained stable at $947 million with net charge-off ratio increasing to 1.24% as compared to 1.28% in the corresponding period last year. Consumer investment assets saw an increase of $28 billion or 15% to $220 billion on the back of strong client flows and market performance. The bank opened 17 new financial centers during 2QFY19 while 45 centers were renovated.
Global Wealth and Investment Management: Net income for the segment grew by 11% to $1.1 billion with pre-tax margin increasing to 29%. Total client balances stood at $2.9 trillion with Loan growth of 3% to $166 billion and deposits growth of 7% to $245 billion on a yoy basis.

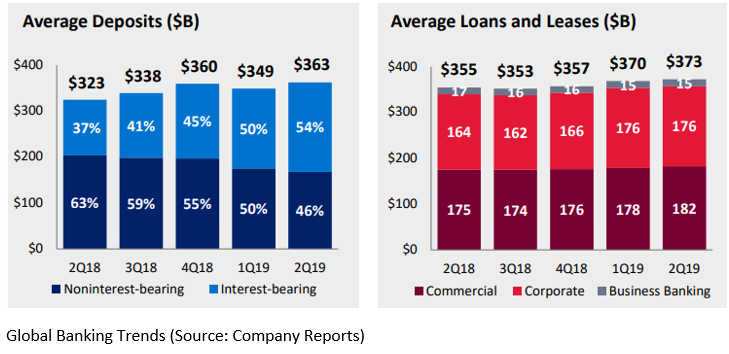
Global Banking: Contrary to other segments, net income growth saw a decrease of 9% to $1.9 billion. Loans and deposits posted a growth of 5% to $373 billion and 12% to $363 billion, respectively.
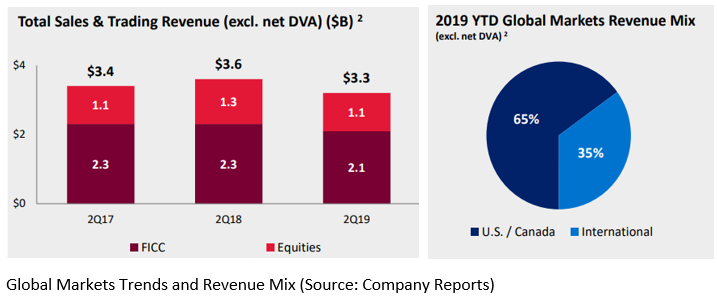
Global Markets: Sales and trading revenue for the quarter stood at $3.2 billion, including net debit valuation adjustment (DVA) losses of $31 million. Ex-net DVA, sales and trading revenue were down 10% to $3.3 billion with Fixed Income Currencies and Commodities (FICC) down 8% to $2.1 billion and equities down 13% to $1.1 billion. Looking at the global markets’ revenue mix on YTD 2019, 65% of the revenue comes from U.S./Canada whereas the rest 35% comes from the international market.
All other business parts such as asset and liability management activities, equity investments, non-core mortgage loans, and servicing activities, liquidating businesses, etc., accounted for the net income of $9 million as compared to a net loss of $349 million in 2Q18.
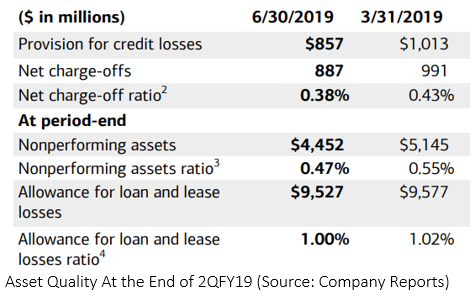
Asset Quality: Overall credit quality improved across both consumer and commercial portfolio with provisions for credit losses at $857 millionat the end of second quarter 2019, improving from the previous quarter end of $1013 million. Non-performing assets witnessed a fall to $ 4,452 million from $5,145 million at the end of the previous quarter.
Key return and efficiency ratios at the end of 2QFY19 came in higher with return on average assets at 1.23% (up, 6 bps), return on average common shareholders’ equity at 11.62% (up, 87 bps) and efficiency ratio at 57%, improving by 117 bps. Coming to the capital and liquidity, CET1 (Common Equity Tier 1) ratio further improved to 11.7% as compared to 11.6% in the previous quarter and 11.4% on pcp. BVPS (Book value per share) went up by 10% to $26.41. The company has plan to return $37 billion of capital to common shareholders over next four quarters which will result in an increase of 20% in quarterly dividend and more than $30 billion in gross share repurchases.
Bank’s leading position in the banking space, an excellent set of numbers in the second quarter of 2019, improved asset quality, higher loan and deposit growth, etc., strengthen the outlook of the bank. Going forward, in the second half of 2019, the Management expects NII to benefit from growth in loans and deposits, and an additional day of interest in 3Q. Expenses in the second half are expected to more or less equal to the expenses in the first half. Higher investment in technology is also expected along with the increased cost of adding new client-facing professional.
The stock, on the daily technical chart, has immediate support at ~$26.6 level and resistance at $33 level. At the current price of $29.19, the stock is available at a price to book multiple of 1.0x, lower as compared to the industry median of 1.2x, which indicates a probable upside still remains at the current level.At the current market price, the current dividend yield stands at 2.05%. Currently, the stock is trading close to its 52-week high level of $31.91 with PE multiple of 10.43x. Hence, considering aforesaid facts and current trading level, we recommend a “Hold” recommendation on the stock at the current market price of $29.19 per share (up 0.69% on 17 July 2019).
 (1).png)
BAC Daily Chart (Source: Thomson Reuters)
Disclaimer
The advice given by Kalkine Pty Ltd and provided on this website is general information only and it does not take into account your investment objectives, financial situation or needs. You should therefore consider whether the advice is appropriate to your investment objectives, financial situation and needs before acting upon it. You should seek advice from a financial adviser, stockbroker or other professional (including taxation and legal advice) as necessary before acting on any advice. Not all investments are appropriate for all people. Kalkine.com.au and associated pages are published by Kalkine Pty Ltd ABN 34 154 808 312 (Australian Financial Services License Number 425376). The information on this website has been prepared from a wide variety of sources, which Kalkine Pty Ltd, to the best of its knowledge and belief, considers accurate. You should make your own enquiries about any investments and we strongly suggest you seek advice before acting upon any recommendation. Kalkine Pty Ltd has made every effort to ensure the reliability of information contained in its newsletters and websites. All information represents our views at the date of publication and may change without notice. To the extent permitted by law, Kalkine Pty Ltd excludes all liability for any loss or damage arising from the use of this website and any information published (including any indirect or consequential loss, any data loss or data corruption). If the law prohibits this exclusion, Kalkine Pty Ltd hereby limits its liability, to the extent permitted by law to the resupply of services. There may be a product disclosure statement or other offer document for the securities and financial products we write about in Kalkine Reports. You should obtain a copy of the product disclosure statement or offer document before making any decision about whether to acquire the security or product. The link to our Terms & Conditions has been provided please go through them and also have a read of the Financial Services Guide. On the date of publishing this report (mentioned on the website), employees and/or associates of Kalkine Pty Ltd do not hold positions in any of the stocks covered on the website. These stocks can change any time and readers of the reports should not consider these stocks as advice or recommendations.
 AU
AU

 Please wait processing your request...