Energizer Holdings, Inc
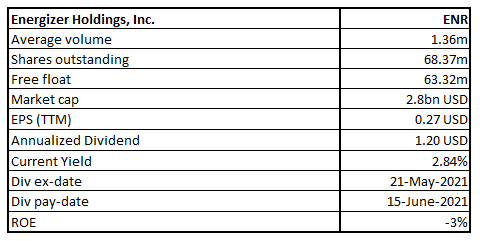
ENR Details
Energizer Holdings, Inc (NASDAQ: ENR) is one of the world’s leading manufacturers of primary batteries and portable lighting products. It has key global brands viz; Energizer®, EVEREADY®, Rayovac®, and VARTA®.
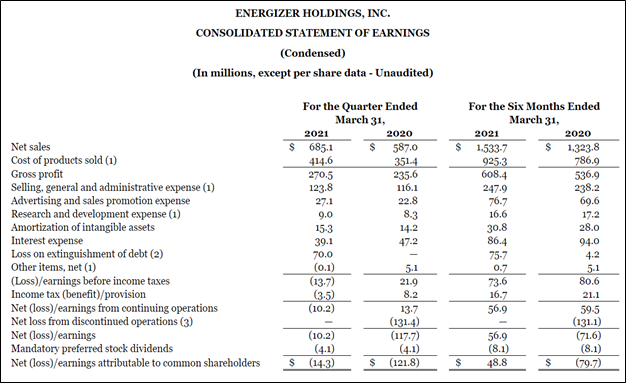
Q2FY21 Result Performance (For the Second Quarter Ended 31 March 2021)
Robust demand across batteries and auto in both geographical segments has resulted in a net sales growth of 16.7% to $685.1 million. However, it witnessed a 110 basis points decline in adjusted gross margin from 41.6% in the prior year to 40.5% in FY21 mainly weighed down by the channel, customer, and product mix along with the impact of operating costs. The benefits of synergies of around $14 million and favourable currency exchange rates helped partially offset margin impacts. Meanwhile, it has reported a diluted net loss from continuing operations per common share of $0.21 due to a loss related to debt refinancing of $0.78 per share.
Financial Snapshot (Source: Company Reports)
Outlook
The company posted strong performance across categories and geographies resulting in organic net sales growth of 12.7% or $74.7 million in Q2FY21.
ENR is expecting to achieve net sales growth in the range of 5% to 7% for FY21 owing to distribution gains, higher battery demand, and favourable currency impacts. It also expects to attain adjusted earnings per share of between $3.30 to $3.50 and adjusted EBITDA in the range of $620-$640 million. Further, it estimates its adjusted free cash flow to stay at the lower end of its earlier guided range of $325 to $350 million due to working capital requirements, with respect to inventory to cater to increased demand.
Key Risks
The company is exposed to the risk of currency fluctuations, which may adversely hurt its financial performance. Volatility in production costs primarily the raw material prices, could erode its profit margins. Further, the risk of changes in the retail environment and consumer preferences also remain a major concern. Moreover, it faces the risk of supply chain disruption due to its reliance on certain significant suppliers.
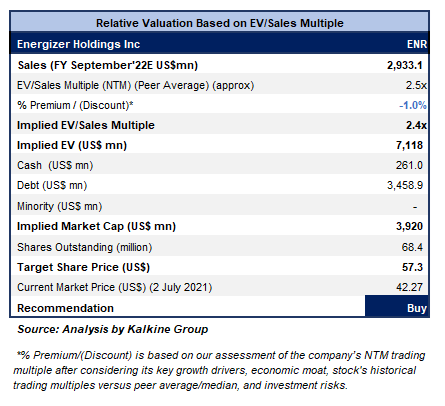
Valuation Methodology: EV/Sales Based Relative Valuation (Illustrative)
Technical Overview:
Weekly Chart –
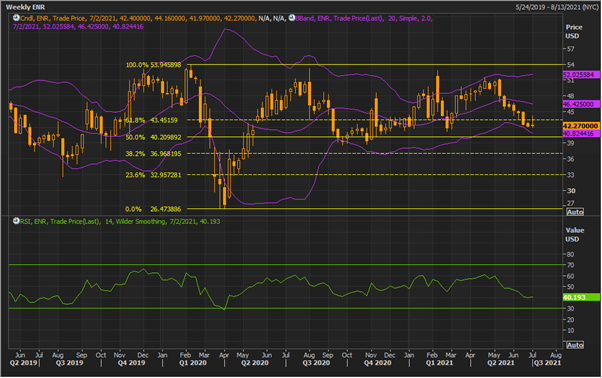
Source: REFINITIV
Note: Purple colour lines are Bollinger Bands® with the upper band suggesting overbought status while the lower band oversold status, and yellow lines are Fibonacci retracement lines which measure price rebound and backtrack. https://www.bollingerbands.com/
The stock fell steeply from the high of $53.95 and made a ‘Double Bottom’ at the low price of $26.47 and from there it again rebounded beyond a 61.8% retracement level of $43.45, and since then it has been experiencing zig-zag movements while remaining in an underlying uptrend. For the ongoing week, the stock has given a close above the previous week’s close with an ‘Inverted Hammer’ formed on the chart thereby indicating bullish reversal for the stock. The technical indicator RSI with a reading around 40, suggests neutral momentum for the stock.
Going forward, the stock may have resistance around $48.00 whereas support could be around the 50% retracement level of $40.21.
Stock Recommendation
The stock of the company declined by ~12.02% in 1 year. It has made a 52-week low and high of $38.59 and $53.19, respectively.
We have valued the stock using an EV/Sales multiple-based illustrative relative valuation and have arrived at a target price that reflects a rise of low double-digit (in % terms). We have assigned a slight discount to EV/Sales Multiple (NTM) (Peer Average) considering cost side inflation and expectation of lower adjusted free cash flow generation due to higher capex. Meanwhile, the company has announced its intention of the broad-based increase in prices across its global battery business to equipoise the impact of cost side pressure. These price increases will be phased in throughout fiscal 2022 and it aims to generate the entire benefit of these changes in the back half of fiscal 2022. For the purposes of relative valuation, we have taken peers like Reynolds Consumer Products Inc (REYN.OQ), Church & Dwight Co Inc (CHD.N), to name a few.
Considering the aforementioned factors, elevated battery demand, steady strong organic growth, and decent outlook, we give a “Buy” recommendation on the stock at the current market price of $42.27 per share, down by 2.18% on 2nd July 2021.
Note 1: The reference data in this report has been partly sourced from REFINITIV.
Note 2: Investment decisions should be made depending on the investors’ appetite on upside potential, risks, holding duration, and any previous holdings. Investors can consider exiting from the stock if the Target Price mentioned as per the analysis has been achieved and subject to the factors discussed above alongside support levels provided.
Technical Indicators Defined:-
Support: A level where-in the stock prices tend to find support if they are falling, and downtrend may take a pause backed by demand or buying interest.
Resistance: A level where-in the stock prices tend to find resistance when they are rising, and uptrend may take a pause due to profit booking or selling interest.
Disclaimer - This report has been issued by Kalkine Pty Limited (ABN 34 154 808 312) (Australian financial services licence number 425376) (“Kalkine”) and prepared by Kalkine and its related bodies corporate authorised to provide general financial product advice. Kalkine.com.au and associated pages are published by Kalkine.
Any advice provided in this report is general advice only and does not take into account your objectives, financial situation or needs. You should therefore consider whether the advice is appropriate to your objectives, financial situation and needs before acting upon it.
There may be a Product Disclosure Statement, Information Statement or other offer document for the securities or other financial products referred to in Kalkine reports. You should obtain a copy of the relevant Product Disclosure Statement, Information Statement or offer document and consider the statement or document before making any decision about whether to acquire the security or product.
You should also seek advice from a financial adviser, stockbroker or other professional (including taxation and legal advice) as necessary before acting on any advice in this report or on the Kalkine website. Not all investments are appropriate for all people.
The information in this report and on the Kalkine website has been prepared from a wide variety of sources, which Kalkine, to the best of its knowledge and belief, considers accurate. Kalkine has made every effort to ensure the reliability of information contained in its reports, newsletters and websites. All information represents our views at the date of publication and may change without notice.
Kalkine does not guarantee the performance of, or returns on, any investment. To the extent permitted by law, Kalkine excludes all liability for any loss or damage arising from the use of this report, the Kalkine website and any information published on the Kalkine website (including any indirect or consequential loss, any data loss or data corruption). If the law prohibits this exclusion, Kalkine hereby limits its liability, to the extent permitted by law, to the resupply of services.
Please also read our Terms & Conditions and Financial Services Guide for further information.
On the date of publishing this report (referred to on the Kalkine website), employees and/or associates of Kalkine do not hold interests in any of the securities or other financial products covered on the Kalkine website.
 AU
AU
.jpg)
 Please wait processing your request...