BHP Billiton

BHP Details
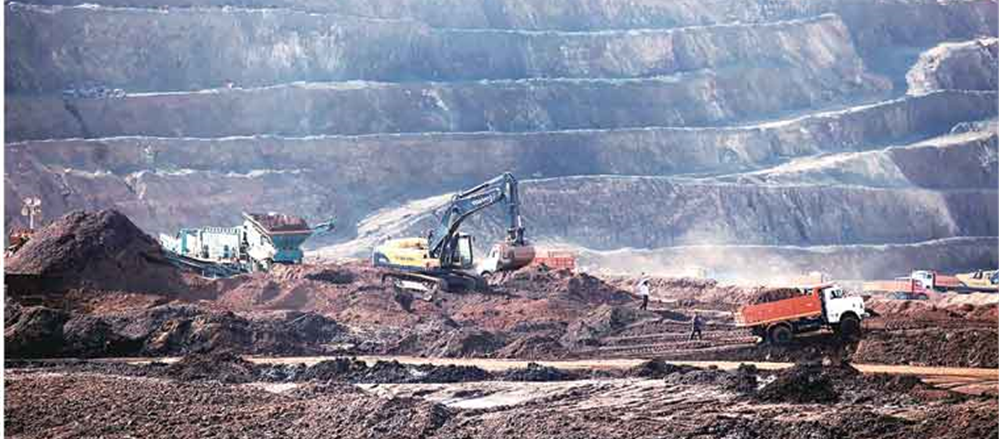
Long-Term Outlook Remains Positive: BHP Billiton Limited (ASX: BHP) is a large-cap company with the market capitalization of circa $107.85 billion as of September 24, 2018. It is the well-diversified commodity company with the principle activity of exploration, development & production of oil and gas, mining of copper, silver, lead, zinc, molybdenum, uranium, gold, iron ore, metallurgical coal, and energy coal. Moreover, it has four main business verticals, i.e., Petroleum, Copper, Iron ore and Coal which contributed around 12.4%, 30.4%, 33.9%, and 20.4% revenue in total revenue respectively, in FY18. The company exports its product mix portfolio to Europe, China, Japan, India, South Korea, North America, South America, Rest of Asia and Rest of the world. On the geographic front, the company generates a sale of around 94.7% from export market and rest comes from the domestic market. During FY18, the company registered a consolidated sales growth of 20.7% YoY to the US $ 43,638 Mn. The company had free cash flow of US $15,813 Mn in FY18.
On the other hand, the commodity prices have witnessed a downward momentum in 2018 primarily because of the trade war between US and China along with the expectations that it could hamper growth as well as the demand of the commodities. Furthermore, the rise in trade war tensions pushed copper prices down; however, there has been a surge in the price for copper as seen on London Metal Exchange (LME) last week. Amidst this, the company is expected to achieve the copper production in the range of 1,675-1,770 kt for FY19.

Production and Guidance for FY19 (Source: Company Reports)
Meanwhile, the share price has risen 16.11 percent in the past six months as at September 21, 2018 and traded at higher PE level of 35.66x. Based on foregoing and current trading level, we maintain our “Hold” recommendation on the stock at the current market price of $33.83 as the company is well placed to meet the demand for commodities that the world needs well into the future.
.png)
BHP Daily Chart (Source: Thomson Reuters)
Rio Tinto

RIO Details
Hydro Terminates Offer for Rio Tinto Aluminium Asset: Hydro has recently withdrawn its offer to buy Rio Tinto Limited’s (ASX: RIO) ISAL aluminium plant, in Iceland which was expected to close in the second quarter of 2018. The total value of the offer was $345 Mn comprising of 53.3 percent share in the Aluchemie anode plant in the Netherlands and its 50 percent share in the Aluminium fluoride plant in Sweden. Following initial feedback from the European Commission (EC), Hydro has withdrawn its EC merger filing and terminated the transaction. On the other hand, the group has announced US$5.0 Bn of divestments in the 1H 2018, supported by the sale of the Queensland coal assets. The pending sale of Grasberg for US$3.5 Bn and the Coal & Allied sale (i.e., US$2.7 Bn) in 2017 will lift total asset sales to US$11.2bn in the next two years. Furthermore, the group will continue to invest in Tier 1 growth to strengthen its portfolio and maintain its balance sheet in order to deliver superior returns to shareholders in the short, medium and long-term. The group has now announced to return $7.2 billion to shareholders and this includes $3.2 billion through operations. In the long run, the company expects to witness higher demand with regard to its premium products as well as robust growth globally.

Strategic Disposals Announced Since 2017 (Source: Company Reports)
On the financial front, ROE and RoIC stood at 10.1% and 5.9%, respectively in 1HFY18 which is above the industry median. As a result, quick ratio and current ratio came in at 1.11x and 1.47x in 1HFY18, representing a decent liquidity position of the firm. As of 30 June 2018, the group had a free cash flow of circa $2.9 Bn. Meanwhile, the share price has fallen 4.34 percent in the past three months as at September 21, 2018 and traded close to higher level. We expect that the positive factors have already been discounted in the price at the current juncture. Hence, we maintain our “Expensive” recommendation on the stock at the current market price of $78.52.
.png)
RIO Daily Chart (Source: Thomson Reuters)
Independence Group NL

IGO Details
Stellar Performance in FY18:Independence Group NL (ASX: IGO) has recently reported stellar FY18 performance in which revenue and other income grew by 85 per cent to $780.6 Mn as against $421.9 Mn in last year. The sales spiked up due to a successful delivery of the first year of commercial production at Nova, strong gold production from Tropicana, improved Australian dollar metal prices and a rationalization of the product portfolio. Resultantly, the underlying EBITDA increased substantially by 125% to $388.6 Mn in FY18 as compared to last year. NPAT lifted by 210% and amounted to $52.7 Mn in FY18. Based on solid performance, the Board of Directors declared a fully franked final dividend of 2 cents per share for its shareholders and it will be payable on September 27, 2018 with the record date of September 14, 2018. This summarized a total dividend payment of 3.0 cents per share for the full year.

FY18 Financial Highlights (Source: Company Reports)
On the valuation front, the company has a price-to-earnings ratio of 51.45x as of September 24, 2018. It has posted Return of Equity (RoE) of 3.0%, Return on Capital Employed (RoCE) of 2.5% and has a debt-to-equity ratio of 0.8x in FY18. Besides this, the current ratio stood at 2.90x in FY18 which is above the Industry Median (1.66x). Over the last five years, the company’s revenue and PAT have grown at a CAGR of 18.2 per cent and 2.0 per cent, respectively. As of now, the group focuses on unlocking the additional value from both Nova and Tropicana sites through ongoing development plan at the back of delivering step change growth through exploration, processing to produce nickel sulphate, and the expansion of its portfolio. Meanwhile, the share price has fallen 7.78% in the past three months as at September 21, 2018 and traded close to 52-week high level. Hence, we maintain our “Hold” recommendation on the stock at the current market price of $4.590 given the long-term potential.
.png)
IGO Daily Chart (Source: Thomson Reuters)
Oz Minerals
.png)
OZL Details
Update on Resource extension drilling program at the Nebo Deposit: Oz Minerals Limited (ASX: OZL) has recently announced a successful program of resource extension drilling at the Nebo Deposit within the West Musgrave Project in Western Australia. As per the release, the program is funded as part of the Earn-in JV Agreement with OZ Minerals Limited. The JV Partners are currently undertaking a Pre-feasibility Study (PFS) on the Nebo-Babel Deposits as well as a regional exploration program. As part of the PFS resource infill drilling program, the number of holes has been designed to target potential high-grade extensions of mineralisation on the peripheries of the current Nebo resource which may have a material impact on the development strategy. In addition to this, the program has also targeted several positions on the eastern margins of the Nebo deposit with significant success from the first round of drilling. We expect that the further opportunities for the discovery of additional high-grade mineralisation will positively impact the mine development.

Nebo Significant drill intercepts (Source: Company Reports)
While looking at the copper commodity which OZL deals in, the requirement under various industries such as transport and electricity has come up while the prices have been on a downtrend given the global level volatility and trade war fears. However, there might be some support from supply front that may help OZL. A nickel/copper sulphide resource has been defined for both deposits, Nebo being higher grade and Babel the larger of the two. Moreover, the company enjoys debt-free status along with a decent cash reserve of $493.4 Mn (as at June 30, 2018).The current ratio and quick ratio stood at 5.96x and 4.16x, respectively in 1HFY18, representing adequate liquidity to fulfill any shortcoming liability in near future.
The share price was down by 4.52 percent in the past three months (as at September 21, 2018) and traded at PE level of 9.99x. But the stock still looks at a higher side; hence, we maintain our “Expensive” recommendation at the current market price of $ 9.210.
.png)
OZL Daily Chart (Source: Thomson Reuters)
Disclaimer
The advice given by Kalkine Pty Ltd and provided on this website is general information only and it does not take into account your investment objectives, financial situation or needs. You should therefore consider whether the advice is appropriate to your investment objectives, financial situation and needs before acting upon it. You should seek advice from a financial adviser, stockbroker or other professional (including taxation and legal advice) as necessary before acting on any advice. Not all investments are appropriate for all people. Kalkine.com.au and associated pages are published by Kalkine Pty Ltd ABN 34 154 808 312 (Australian Financial Services License Number 425376). The information on this website has been prepared from a wide variety of sources, which Kalkine Pty Ltd, to the best of its knowledge and belief, considers accurate. You should make your own enquiries about any investments and we strongly suggest you seek advice before acting upon any recommendation. Kalkine Pty Ltd has made every effort to ensure the reliability of information contained in its newsletters and websites. All information represents our views at the date of publication and may change without notice. To the extent permitted by law, Kalkine Pty Ltd excludes all liability for any loss or damage arising from the use of this website and any information published (including any indirect or consequential loss, any data loss or data corruption). If the law prohibits this exclusion, Kalkine Pty Ltd hereby limits its liability, to the extent permitted by law to the resupply of services. There may be a product disclosure statement or other offer document for the securities and financial products we write about in Kalkine Reports. You should obtain a copy of the product disclosure statement or offer document before making any decision about whether to acquire the security or product. The link to our Terms & Conditions has been provided please go through them and also have a read of the Financial Services Guide. On the date of publishing this report (mentioned on the website), employees and/or associates of Kalkine Pty Ltd do not hold positions in any of the stocks covered on the website. These stocks can change any time and readers of the reports should not consider these stocks as advice or recommendations.
 AU
AU
 Please wait processing your request...