The IBX seeks daily investment results, before fees and expenses, of 200% (2x long) of the daily performance of IBM. The fund is an exchange-traded product designed to deliver twice the daily percentage gain of IBM stock, one of the world’s largest enterprise technology and artificial intelligence companies.

IBM operates across several major technology segments, including hybrid cloud computing, artificial intelligence, enterprise software, cybersecurity, consulting, and infrastructure services. The company has increasingly positioned itself as a leader in enterprise AI solutions through its Watson platform and partnerships focused on cloud modernization and automation. As a result, IBX provides leveraged exposure to a globally recognized technology company whose performance is closely tied to enterprise IT spending, AI adoption, digital transformation initiatives, and broader technology market sentiment.
Unlike diversified technology ETFs, IBX’s performance depends almost entirely on IBM’s stock movement. Factors such as quarterly earnings results, AI-related growth, hybrid cloud adoption, government and enterprise contracts, software revenue trends, and broader macroeconomic conditions can significantly influence IBM’s price action. During periods of strong earnings performance, favorable guidance, or bullish sentiment toward AI and enterprise technology, IBM shares may experience accelerated upside moves that IBX aims to amplify on a daily basis.
Traders seeking to capitalize on short-term upward movements in IBM—often driven by earnings surprises, AI optimism, enterprise software demand, or positive technology sector momentum—can use IBX as a leveraged instrument to express a bullish view on the stock.
The ETF has a focused and leveraged objective:
- To seek daily investment results, before fees and expenses, corresponding to two times (2x) the daily performance of IBM stock.
This ETF is not intended for long-term investors. It is a specialized, high-risk instrument designed for experienced traders who understand leverage and actively manage positions.
Intended Uses
- Leveraged Bullish Exposure
Traders with short-term conviction that IBM stock will rise—due to strong earnings, AI-related growth, cloud adoption, or positive enterprise technology sentiment—may use this ETF to amplify potential gains.
- Event-Driven Trading
The ETF can be used around major catalysts such as IBM earnings releases, AI product announcements, strategic partnerships, enterprise contract wins, or macroeconomic data influencing technology spending.
- Tactical Single-Stock Positioning
Active traders may use IBX to gain leveraged exposure to IBM without directly purchasing shares, enabling short-term participation in momentum-driven moves.
Key Considerations and Risks
- Compounding Risk:
IBX resets leverage daily. Over holding periods longer than one trading day, performance may differ significantly from 2x the cumulative return of IBM stock, particularly during volatile market conditions.
- Single-Stock Risk:
Unlike diversified ETFs, IBX is entirely dependent on one company, increasing exposure to company-specific developments such as disappointing earnings, slower cloud growth, or weaker guidance.
- High Volatility:
Leveraged ETFs amplify both gains and losses. Although IBM is generally less volatile than many growth technology stocks, leverage can still produce significant price swings.
- Technology Sector Sensitivity:
IBM is influenced by enterprise technology spending, interest rates, AI investment trends, and broader market sentiment toward large-cap technology companies.
- AI and Cloud Competition Risk:
IBM competes with major cloud and AI providers, meaning competitive pressures and innovation cycles can materially affect investor sentiment and stock performance.
- Liquidity and Trading Risk:
Leveraged ETFs can experience sharp intraday moves and wider bid-ask spreads during periods of heightened volatility.
- Higher Costs:
Leveraged ETFs generally carry higher expense ratios due to the operational costs associated with maintaining leverage exposure.
Technical Price Behavior Context
IBX tends to exhibit amplified versions of IBM’s chart patterns:
- Strong bullish trends in IBM → accelerated upside in IBX
• Pullbacks or consolidations → magnified downside moves
• Breakouts on rising volume → sharp momentum-driven rallies
Because of this, traders often align IBX entries with technical setups in IBM stock, such as:
- Breakouts above resistance levels
• Pullbacks toward key moving averages
• RSI momentum reversals
• Volume expansion during rallies
• Trend continuation patterns following earnings
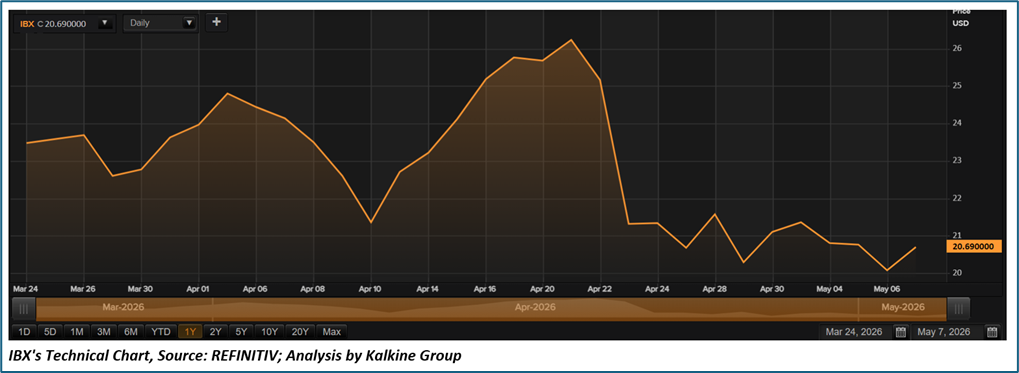
Technical Price Chart

Conclusion
The IBX is a tactical leveraged instrument designed for traders seeking to capitalize on short-term bullish movements in IBM stock. By offering 2x daily exposure, the ETF enables amplified participation in periods of strong enterprise technology demand, AI-driven optimism, and positive earnings momentum.
However, due to daily leverage resets, single-stock concentration, and elevated volatility, IBX carries substantial risk. It requires active monitoring, disciplined risk management, and a clearly defined short-term trading strategy, making it more suitable for experienced traders than long-term investors.
Note 1: Past performance is not a reliable indicator of future performance.
Note 2: Reference data for price, technical indicators, support, and resistance levels is as of May 7, 2026 and may be sourced from market data providers such as REFINITIV.
Note 3: Investment decisions should consider an individual’s risk appetite, upside potential, holding period, and prior holdings.
Note 4: Market data may be subject to delays, and information is subject to change without notice.

 CA
 NZ
 UK
 US
 IND

 AU

 Please wait processing your request...