
Stocks’ Details
Equifax, Inc.
Shift of EFX’s Data, Analytics, & Application Infrastructure to Cloud is a Key Positive: Equifax, Inc. (NYSE: EFX) is engaged in providing information solutions and human resources business-process outsourcing facilities for governments, businesses, and consumers.
Q4FY19 Operational Highlights for the Period ended 31 December 2019: EFX announced its quarterly results, wherein the company reported total revenues of $905.8 million as compared to $835.3 million in the year-ago period. On reported basis,revenues went up 8% year over year and 10% on a local currency basis. Adjusted earnings per share came in at $1.53 and increased 11% on a year-over-year basis. Continuous migration of the company’s data, analytics, and application infrastructure to cloud-based technology remains a key catalyst. During the quarter, EFX reported adjusted EBITDA margin of 35.2%, up 33.2% on the year-ago quarter. EFX exited the quarter with a cash balance of $401.3 million and long-term debt of $3.38 billion.
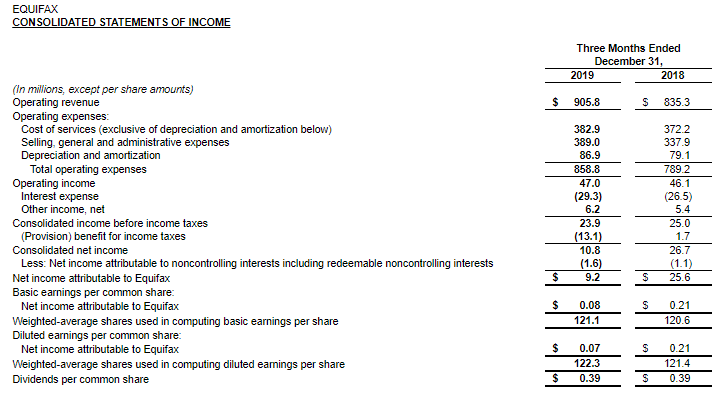
Key Financial Highlights (Source: Company Reports)
Outlook for FY20:For FY20, the company expects revenue to be in the range of $3.65 billion-$3.75 billion, depicting year over year growth of 4-7%. The figures also include a 1% negative impact from foreign exchange movement. The company predicts adjusted EPS to be in the range of $5.60 and $5.80, with an expected negative foreign exchange impact of 3 cents.
Valuation Methodology: Price to Earnings Multiple Based Relative Valuation
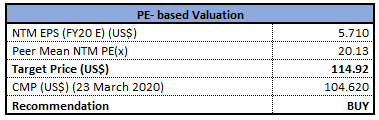
Price to Earnings Based Valuation (Source: Thomson Reuters)
Note: All forecasted figures and peers have been taken from Thomson Reuters, NTM-Next Twelve Months
Stock Recommendation: The stock of EFX closed at $104.62 with a market capitalization of ~$12.68 billion. The stock is currently quoting at the lower band of its 52-week trading range of $103.01 to $164.77. The company made considerable improvement in its multi-year $1.25 billion EFX 2020 cloud technology transformation in FY19. Considering the aforesaid facts, we have valued the stock using price to earnings multiple based relative valuation method. For the purpose, we have taken the peer group - TransUnion (NYSE: TRU), Verisk Analytics Inc (NASDAQ: VRSK), Factset Research Systems Inc (NYSE: FDS), to name few, and arrived at a target price of lower double-digit growth (in % terms). Hence, we recommend a “Buy” rating on the stock at the closing price of $104.62, down 0.97% as on 23 March 2020.
F5 Networks, Inc.
Revenues up 5% Year Over Year: F5 Networks, Inc. (NASDAQ: FFIV) is an information technology company that is engaged in developing powers applications within the multi-cloud environment. Recently, the company allowed electronic voting of shares on March 12, 2020 at F5’s headquarters in Seattle, Washington, owing to the coronavirus outbreak. The move aims to protect the health and well-being of the company’s shareholders and employees.
Q1FY20 Operational Highlights for the Period ended 31 December 2019: During the quarter, company reported revenue of $569.3 million, an increase of 5% on a year over year basis, driven by 50% growth in software solutions revenue. Gross profit for the quarter came in at $480.66 million, up from $457.05 million in the year-ago period. The company reported research and development expenses at $96 million, up from $92.03 million in Q1FY19. The company reported net income of $98.52 million, down from $130.90 million in Q1FY19, owing to higher sales and marketing expenses and general and administrative expenses.FFIV exited the quarter with a cash balance of $735.5 million.
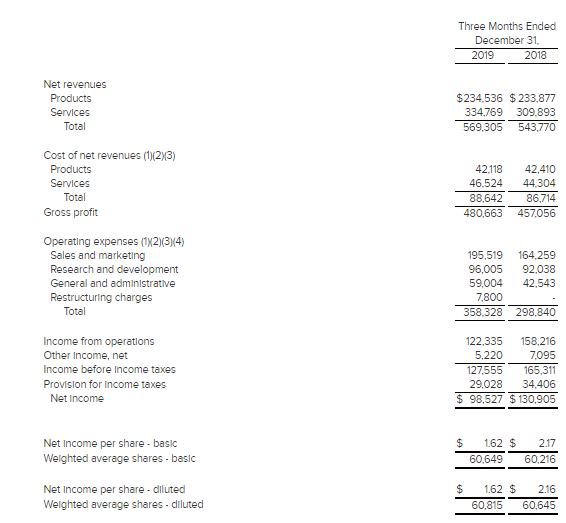
Q1FY20 Income Statement Highlights (Source: Company Reports)
Outlook: On a non-GAAP basis, the company expects its revenue to be in the range of $580 million to $590 million for the coming quarter. The company expects non-GAAP earnings to be in the ambit of $2.14 to $2.17 per diluted share.
Valuation Methodology:Price to Earnings Multiple Based Relative Valuation

Price to Earnings Based Valuation (Source: Thomson Reuters)
Note: All forecasted figures and peers have been taken from Thomson Reuters, NTM-Next Twelve Months
Stock Recommendation: The stock of FFIV is quoting at $98.65 with a market capitalization of $5.99 billion. The stock is trading at the lower band of its 52-week trading range of $79.78 to $168.94. FFIV remains on track to provide world-class applications & services to its customers. In 1QFY20, demand from the software solutions and related services and support bolstered 5% growth in total revenue. Considering the above factors, we have valued the stock using one relative valuation method, i.e., Price to Earnings multiple based approach. For this, we have taken peers like Cisco Systems Inc (NASDAQ: CSCO), Juniper Networks Inc (NYSE: JNPR) and International Business Machines Corp (NYSE: IBM) and arrived at a target price with single-digit upside (in % terms). Hence, we give a “Hold” rating on the stock at the current market price of $98.65, down 1.49% as on 23 March 2020.
Fortinet Inc.
Revenues up a Whopping 21% Year Over Year: Fortinet Inc. (NASDAQ: FTNT) is a cybersecurity company, which is engaged in providing services to a wide range of businesses, such as communication service providers, enterprises and small businesses. Recently, the company unveiled its latest Fortinet Engage partner program, which focuses primarily on growing markets, including SD-WAN and cloud, in order to enhance business growth prospects.
Q4FY19 Operational Highlights for the Period ended 31 December 2019: During the quarter, the company reported non-GAAP earnings per share of 76 cents, up from the year-ago figure of 59 cents. Revenues for the quarter came in at$614.4 million, an increase of 21% year over year. Segment wise, Product revenues increased 19% year over year, whereas Services revenues went up by 23. On geographical basis, revenues from America increased 23%, went up by 22% in APAC and 19% in EMEA. Cash flow from operations during the period stood at $190.4 million, with free cash flow amounting t0 $143.2 million.
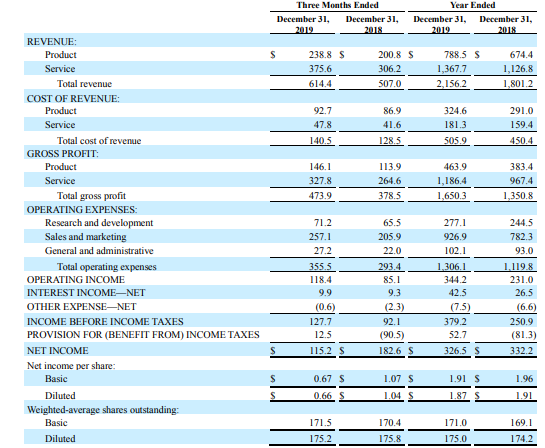
4QFY19 Key Highlights(Source: Company Reports)
Outlook: For FY20, the company expects revenues to be between $2.525-$2.555 billion, whereas non-GAAP earnings per share is expected to be between $2.70-$2.73. The company expects billing to be between $3.025-$3.075 billion. Non-GAAP gross margin is expected in the ambit of 77.5-78.5% and operating margin is predicted in the range of 23.5% and 24.5%.
Valuation Methodology: Price to Earnings Multiple Based Relative Valuation
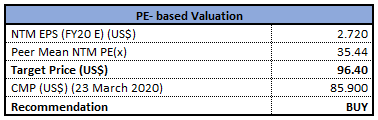
Price to Earnings Based Valuation (Source: Thomson Reuters)
Note: All forecasted figures and peers have been taken from Thomson Reuters, NTM-Next Twelve Months
Stock Recommendation: The stock of FTNT is quoting at $85.9 with a market capitalization of $14.82 billion. The stock is trading at the lower band of its 52-week trading range of $68.87 to $121.82. The company stands to benefit from robust impetus in FortiGate virtual machines, which is driving its private and public cloud billings. Considering the above factors, we have valued the stock using one relative valuation method, i.e., Price to Earnings multiple based approach. For this, we have taken peers like Palo Alto Networks Inc (NYSE: PANW), Check Point Software Technologies Ltd (NASDAQ: CHKP) and FireEye Inc (NASDAQ: FEYE), to name few and arrived at a target price with lower double-digit upside (in % terms). Hence, we give a “Buy” rating on the stock at the current market price of $85.90, up 1.17% as on 23 March 2020.
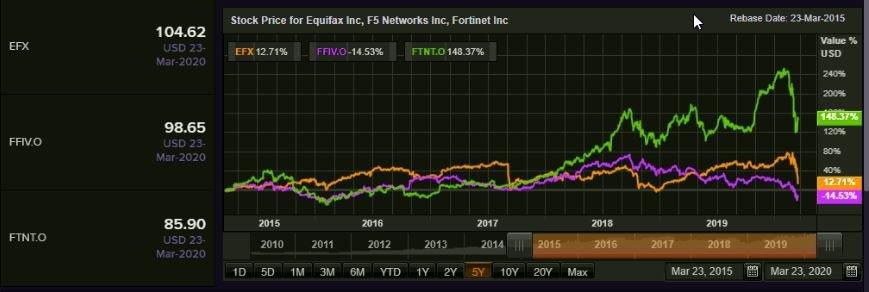
Comparative Price Chart (Source: Thomson Reuters)
Disclaimer
The advice given by Kalkine Pty Ltd and provided on this website is general information only and it does not take into account your investment objectives, financial situation or needs. You should therefore consider whether the advice is appropriate to your investment objectives, financial situation and needs before acting upon it. You should seek advice from a financial adviser, stockbroker or other professional (including taxation and legal advice) as necessary before acting on any advice. Not all investments are appropriate for all people. Kalkine.com.au and associated pages are published by Kalkine Pty Ltd ABN 34 154 808 312 (Australian Financial Services License Number 425376). The information on this website has been prepared from a wide variety of sources, which Kalkine Pty Ltd, to the best of its knowledge and belief, considers accurate. You should make your own enquiries about any investments and we strongly suggest you seek advice before acting upon any recommendation. Kalkine Pty Ltd has made every effort to ensure the reliability of information contained in its newsletters and websites. All information represents our views at the date of publication and may change without notice. To the extent permitted by law, Kalkine Pty Ltd excludes all liability for any loss or damage arising from the use of this website and any information published (including any indirect or consequential loss, any data loss or data corruption). If the law prohibits this exclusion, Kalkine Pty Ltd hereby limits its liability, to the extent permitted by law to the resupply of services. There may be a product disclosure statement or other offer document for the securities and financial products we write about in Kalkine Reports. You should obtain a copy of the product disclosure statement or offer document before making any decision about whether to acquire the security or product. The link to our Terms & Conditions has been provided please go through them and also have a read of the Financial Services Guide. On the date of publishing this report (mentioned on the website), employees and/or associates of Kalkine Pty Ltd do not hold positions in any of the stocks covered on the website. These stocks can change any time and readers of the reports should not consider these stocks as advice or recommendations.
 AU
AU

 Please wait processing your request...