.png)
Stocks’ Details
BHP Group Limited
EBITDA up 15% Year over Year in 1HFY20: BHP Group Limited (ASX: BHP) is engaged in the exploration, production and processing of minerals. The market capitalisation of the company stood at $113.33 Bn as on 3rd 18 February 2020.
1HFY20 Key Highlights for the Period Ended 31st December 2019: Total revenue for the period increased by 3% year over year to US$22,294 Mn. Underlying EBITDA for the period stood at US$12,084 million, up 15% year over year. For 1HFY20, copper production of the group increased by 7% to 885 kt of total production. During the period, the company reported net operating cash flow of US$7,442 million and free cash flow of US$3.7 billion, indicating higher iron ore prices and a strong operating performance.
.png)
Operational Performance (Source: Company Reports)
Guidance for Petroleum Production: For FY20, the company is expecting total petroleum production in the band of 110 and 116 MMboe, and total copper production is expected to be in the range of 1,705kt and 1,820 kt.
Valuation Methodology: P/E Based Valuation
.png)
P/E Based Valuation (Source: Thomson Reuters)
Note: All forecasted figures have been taken from Thomson Reuters, NTM: Next Twelve Months
Stock Recommendation: The company remains positive for its long-term outlook and is well positioned to capitalise on the opportunities from population growth and better living standards. As per ASX, the stock gave a return of ~6% in the past six months. During FY19, net margin of the company stood at 21.5%, higher than the industry median of 11%. This indicates that the company is managing its costs well and can convert its revenue into profits. In the same span, ROE of the company was 16.8% as compared to the industry median of 12.3%. We have valued the stock using P/E based relative valuation method, and for the said purpose, we have considered peers like Fortescue Metals Group Ltd (ASX: FMG), Newcrest Mining Ltd (ASX: NCM) and Rio Tinto Ltd (ASX: RIO), to name few. Therefore, we have arrived at a target price offering an upside of single-digit (in percentage terms). Hence, considering the aforesaid facts and current trading levels, we give a “Hold” rating on the stock at the current market price of $38.78 per share, up 0.806% on 18 February 2020.
Sims Metal Management Limited
Healthy balance Sheet & Cost Cutting Initiatives are Key Catalysts: Sims Metal Management Limited (ASX: SGM) is involved in buying, processing, selling of recycled metals and provision of environmentally responsible solutions for the disposal of post-consumer electronic products.
1HFY20 Key Highlights for the Period Ended 31st December 2019: During the period, sales revenue of the company went down by 18.7% to $2,709.6 million from $3,335.1 million in 1HFY19. Underlying EBITDA stood at $74.9 million, which was down by 56.9% over the prior year. The company declared a fully franked interim dividend of 6 cents per share, representing a decline of 73.9% year over year. SGM net cash position as at 31 December 2019 was $151.2 million.
.png)
Financial Performance (Source: Company Reports)
Outlook: Considering the deteriorating market conditions, the company expects underlying EBIT to be in the range of $40 –$60 million in 2HFY20. The company expects to have an uncertain macroeconomic environment from increasing escalation of trade wars. It also predicts that Coronavirus impact on both ferrous and non-ferrous demand and prices will be a potential headwind. Nonetheless, the company remains positive regarding the gradual recovery of the Turkish economy.
Stock Recommendation: The stock of the company generated a positive return of 12.51% in the past six months. As per the ASX, the stock is currently trading above the average of its 52-week high and low of $12.980 - $8.530 with a price to earnings multiple of 14.49x, and an annual dividend yield of 3.86%. The second half is expected to report a positive underlying EBIT. Moreover, the business will further improve on the back of a strong balance sheet and a disciplined approach to capital expenditure and cost management. On the valuation front, the stock is trading at a price to book multiple of 1.0x as compared to the industry average of 1.2x on TTM (Trailing Twelve Months) basis. Hence, considering the aforesaid facts and current trading levels, we give a “Hold” rating on the stock at the current market price of $10.70 per share, down 1.654% on 18 February 2020.
Western Areas Limited
Revenues up ~26% Year Over Year in 1HFY20: Western Areas Limited (ASX: WSA) is engaged in mining, processing and sale of nickel sulphide concentrate.
1HFY20 Key Highlights for the Period Ended 31st December 2019: Mine nickel production for the period stood at 11,654 tonnes. Mill nickel production for the period stood at 10,658 tonnes. Unit cash cost of nickel in concentrate for the period stood at A$3.07/lb. Nickel sales for the period stood at 9,042 tonnes. The company reported revenues of $156.2 million in 1HFY20, up ~26% from $123.7 million reported in the prior corresponding period. Cash at bank at the end of the period, was reported at $184.9 Mn as compared to $134.3 Mn at the end of 1HFY19. The company declared a dividend of 1 cent per share in 1HFY20.
.png)
Production Overview (Source: Company Reports)
What to Expect: FY20 Nickel production guidance has been estimated in the range of 21,000 to 22,000 tonnes for the full year, with a unit cash cost of nickel in concentrate to be in the range of A$2.90/lb to A$3.30/lb.
Valuation Methodology: Price to Book Value Based Valuation
.png)
Price to Book Value Based Valuation (Source: Thomson Reuters), NTM-Next Twelve Months
Note: All forecasted figures have been taken from Thomson Reuters, NTM: Next Twelve Months
Stock Recommendation: WSA’s construction programme for the Odysseus mine is on schedule and progressing well, which is likely to support the company’s long-term future of profitable nickel production. As per ASX, the stock of gave a return of ~3.24% in the past six months. The stock is currently trading above the average of its 52-week high and low of $3.475 - $1.910 with a price to earnings multiple of 49.13x, and an annual dividend yield of 0.78%. We have valued the stock using P/BV based relative valuation method, and for the said purpose, we have considered peers like Sandfire Resources Ltd (ASX: SFR), OZ Minerals Ltd (ASX: OZL) and Newcrest Mining Ltd (ASX: NCM), to name few. Therefore, we have arrived at a target price offering an upside of single-digit (in percentage terms). Hence, considering the aforesaid facts and current trading levels, we give a “Hold” rating on the stock at the current market price of $2.560 per share, up 0.392% on 18 February 2020.
OZ Minerals Limited
FY19 EBITDA Margin Stood Robust at 42%: OZ Minerals Limited (ASX: OZL) is an Australia based modern mining company which focuses in the exploration of copper and gold.
FY19 Operating Highlights for the Period ended 31 December 2019: OZL announced its FY19 operational highlights, wherein the company posted revenue of $1,107 million, slightly lower from $1,117 million in FY18. The business witnessed lower copper & gold sales, higher gold price, realised losses on gold hedges and lower TCRCs. Underlying EBITDA came in at $462.4 million, lower from $540.4 million in FY18, on account of higher freight and site administration expenditure, rising insurance premiums and restructuring costs. However, the EBITDA margin stood robust at 42%. The business reported operating cash flow of $511 million, up 14% on y-o-y basis, driven by lower tax expenses and company’s transition to progressive instalments in FY18.
.png)
FY19 Financial Highlights (Source: Company Reports)
The board of Directors has announced a fully franked dividend of $0.1500 per ordinary share, with a payment date of 26 March 2020.
Guidance: For FY20, the company expects copper production within the range of 83,000 tonnes to 100,000 tonnes while Gold Production is expected within the range of 207,000 ounces to 234,000 ounces.
Valuation Methodology: Price to Cash Flow Based Valuation
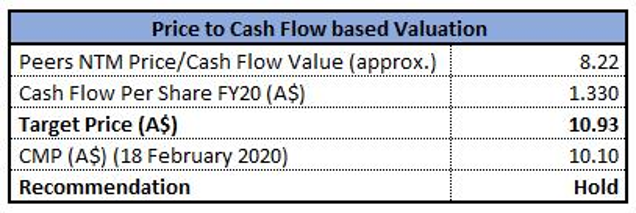
Price to Cash Flow based Valuation (Source: Thomson Reuters)
Note: All forecasted figures and peers have been taken from Thomson Reuters, NTM-Next Twelve Months
Stock Recommendation: The stock of OZL is trading at $10.10 with a market capitalisation of $3.28 billion.The 52-week low and high of the stock stood at $8.470 to $11.720. The stock has delivered a mixed return of -2.31% and 10.83% in the last three months and six months, respectively. The business expects FY20 to be a transitional year, wherein the company will focus on the Carrapateena ramp-up while maintaining the reliable production and cost performance at Prominent Hill. Considering the recent price movement and business prospects, we have valued the stock using Price to Cash Flow based relative valuation method. For the purpose, we have taken peers like IGO Ltd (ASX: IGO), Northern Star Resources Ltd (ASX: NST), Evolution Mining Ltd (ASX: EVN), etc., and arrived at a target price of single-digit upside (in % terms). Hence, we recommend a “Hold” rating on the stock at the current market price of $10.10 per share, down 0.296% on 18th February 2020.
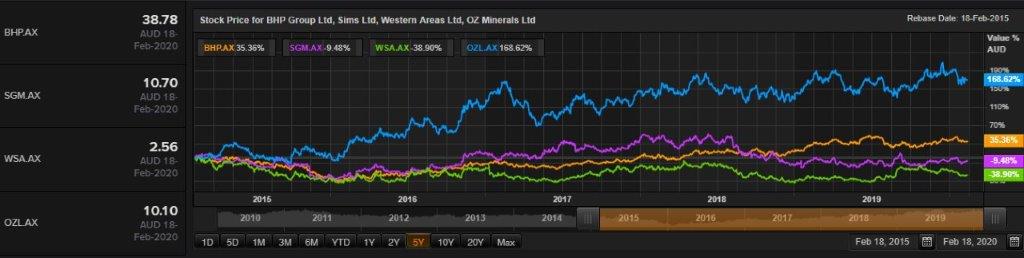
Comparative Price Chart (Source: Thomson Reuters)
Disclaimer
The advice given by Kalkine Pty Ltd and provided on this website is general information only and it does not take into account your investment objectives, financial situation or needs. You should therefore consider whether the advice is appropriate to your investment objectives, financial situation and needs before acting upon it. You should seek advice from a financial adviser, stockbroker or other professional (including taxation and legal advice) as necessary before acting on any advice. Not all investments are appropriate for all people. Kalkine.com.au and associated pages are published by Kalkine Pty Ltd ABN 34 154 808 312 (Australian Financial Services License Number 425376). The information on this website has been prepared from a wide variety of sources, which Kalkine Pty Ltd, to the best of its knowledge and belief, considers accurate. You should make your own enquiries about any investments and we strongly suggest you seek advice before acting upon any recommendation. Kalkine Pty Ltd has made every effort to ensure the reliability of information contained in its newsletters and websites. All information represents our views at the date of publication and may change without notice. To the extent permitted by law, Kalkine Pty Ltd excludes all liability for any loss or damage arising from the use of this website and any information published (including any indirect or consequential loss, any data loss or data corruption). If the law prohibits this exclusion, Kalkine Pty Ltd hereby limits its liability, to the extent permitted by law to the resupply of services. There may be a product disclosure statement or other offer document for the securities and financial products we write about in Kalkine Reports. You should obtain a copy of the product disclosure statement or offer document before making any decision about whether to acquire the security or product. The link to our Terms & Conditions has been provided please go through them and also have a read of the Financial Services Guide. On the date of publishing this report (mentioned on the website), employees and/or associates of Kalkine Pty Ltd do not hold positions in any of the stocks covered on the website. These stocks can change any time and readers of the reports should not consider these stocks as advice or recommendations.
 AU
AU

 Please wait processing your request...