WAM Research Limited


WAX Details
Oversubscribed dividend reinvestment plan shortfall placement: WAM Research Limited (ASX: WAX) has raised $12,501,876.73 million (7.93 million ordinary shares) via dividend reinvestment plan shortfall placement to investors. Moreover, WAX reported a 34.4% growth in the operating profit after tax to $26.2 million in FY 16 driven by the return from the investment portfolio of 25.5% in the year, outperforming the market by 23.5%.
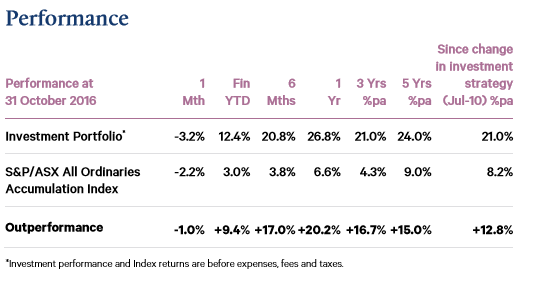

Performance (Source: Company Reports)
Meanwhile, WAX stock rose 18.18% in the last six months (as of November 14, 2016), and still trading at a cheap P/E. We give a “Speculative Buy” recommendation on the stock at the current price of – $ 1.55
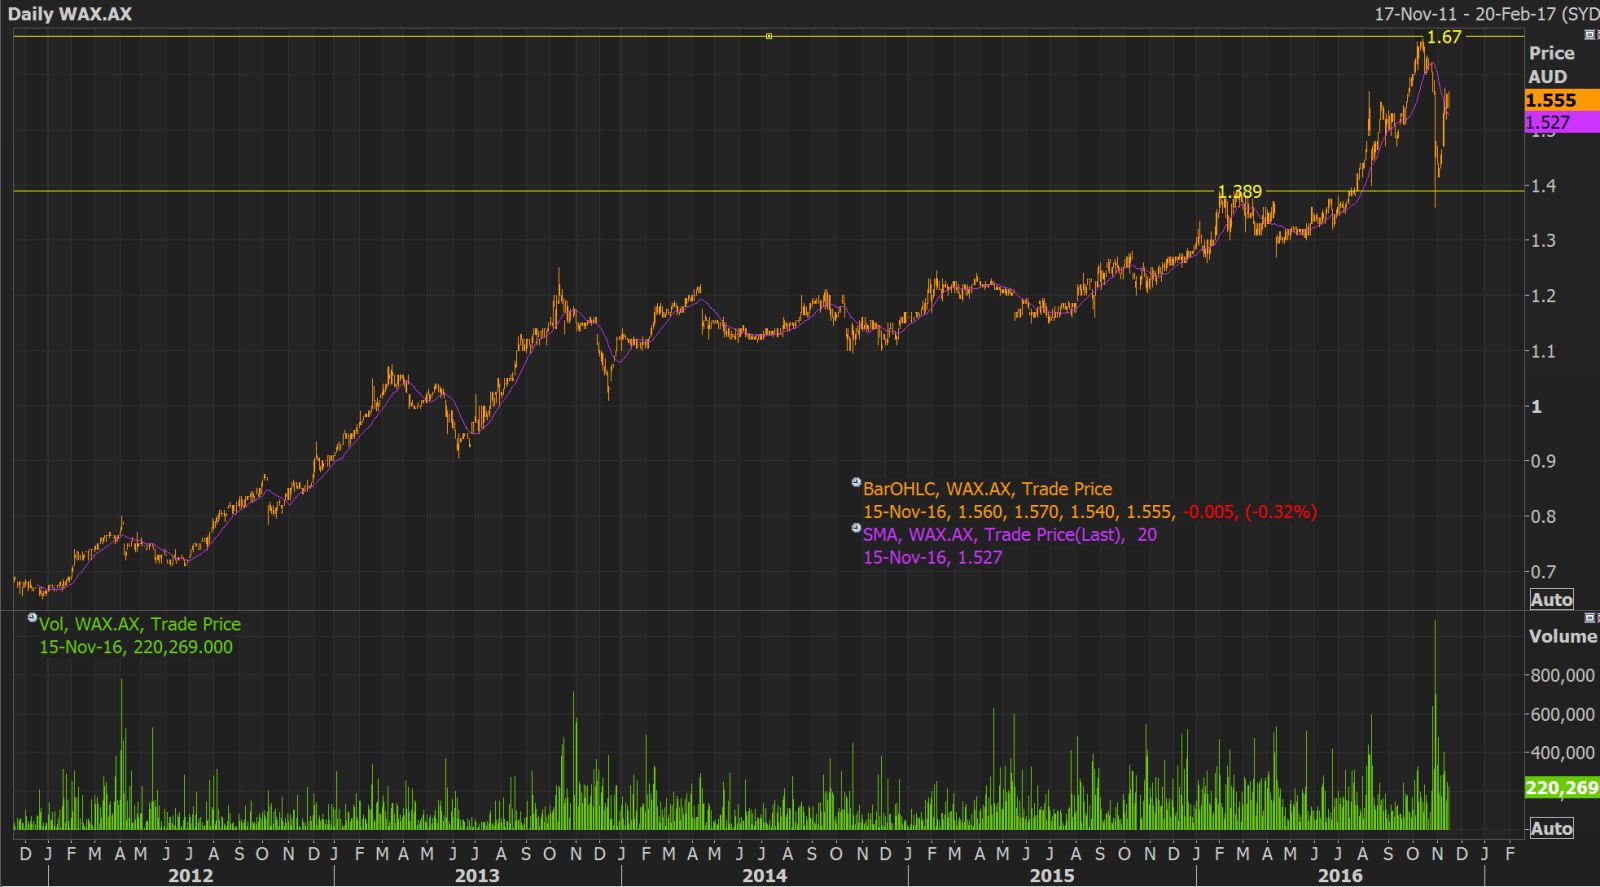
WAX Daily Chart (Source: Thomson Reuters)
Wam Capital Ltd

.PNG)
WAM Details
Capital Management & Strong Profit in FY 16: Wam Capital Limited (ASX: WAM) raised $20.34 million (9 million ordinary shares) via dividend reinvestment plan shortfall placement to investors while raised a capital of $247.2m through the Share Purchase Plan and placement which got significantly oversubscribed. The capital raising initiatives were undertaken at a premium to the WAM’s net tangible assets (NTA) which increased the July pre-tax NTA by $20.0 million or 3.41 cents per share to a pre-tax NTA of 200.09 cents per share. As per October 2016 investment update, the NTA after tax has been 193.4 cents per share.
.png)

Investment Portfolio Performance (Source: Company Reports)
Additionally, WAM reported 85.7% increase in operating profit before tax to $132.3 million in FY 16 due to 21.6% increase in the investment portfolio, which outperformed by 19.6%. As of October 2016, the portfolio performance has been 18.2% since inception outperforming S&P/ASX ALL Ordinaries Accumulation Index by about 10%. WAM stock rose over 6.57% in the last six months (as of November 14, 2016), while the company is having a decent dividend yield and is trading at a reasonable P/E. We give a “Hold” recommendation on the stock at the current price of – $ 2.30
.png)
WAM Daily Chart (Source: Thomson Reuters)
Clime Capital Ltd


CAM Details
Weak Financial Performance in FY 16: Clime Capital Ltd (ASX: CAM) reported a 154% fall in the revenue to $247,717 in FY 16 due to the decrease in realized gains on sale of financial assets and a 422% increase in the loss after tax attributable to members to $639,220. On the other hand, CAM’s CPS is set to be converted into ordinary shares at a ratio of 1.38 to 1 and after this CAM would mandatorily convert these into over 10.1 million ordinary shares.
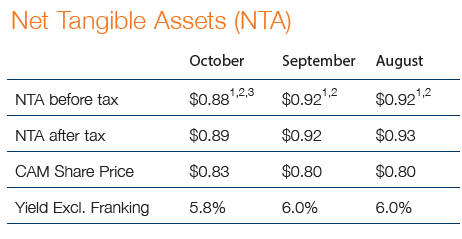

Net Tangible Assets by month (Source: Company Reports)
The immediate impact of this conversion is said to be saving around $900k in franked dividends per annum based on the current rate of ordinary dividends. Additionally, CAM has gone for a buyback of 3,090,282 ordinary shares and a 419,396 preference shares in FY 16. The average discount to Net Tangible Asset backing per share on average was greater than 10%. The group’s portfolio delivered a return of -2.4% in October 2016 owing to receding domestic market while 4.3% returns were delivered on a year-on-year basis. Looking at the prospects, we give an “Expensive” recommendation on the stock at the current price of – $ 0.81
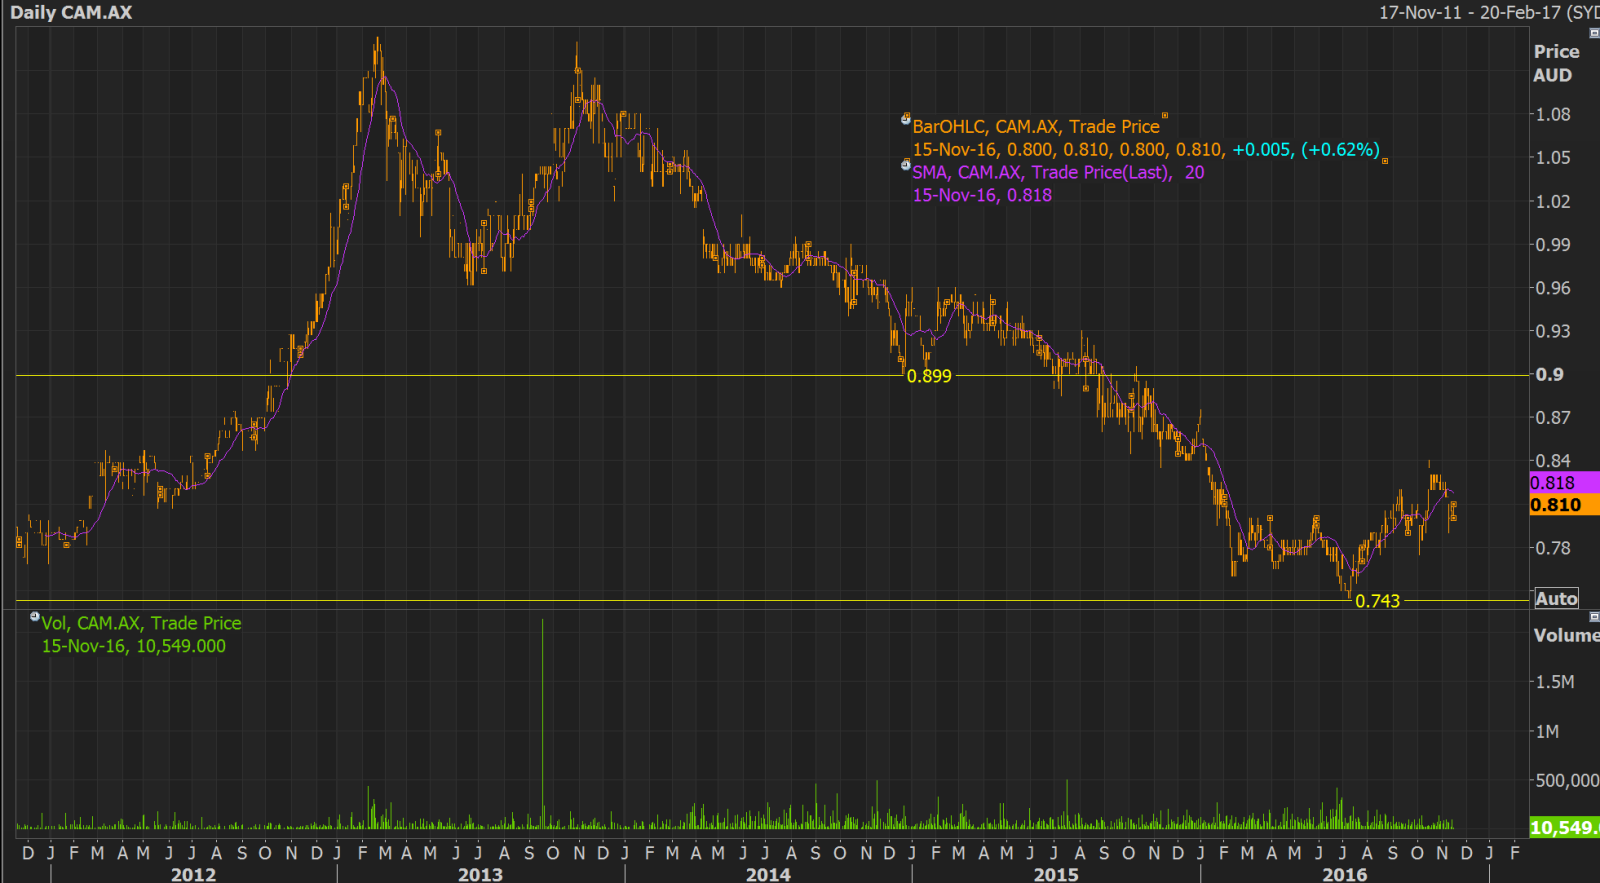
CAM Daily Chart (Source: Thomson Reuters)
Australian Foundation Investment Company Ltd


AFI Details
Subdued Financial Performance in FY 16: Australian Foundation Investment Company Ltd (ASX: AFI) reported a slight drop in net tangible asset backing per share to $4.73 after tax as at October 31, 2016 from $4.84 as at September 30, 2016. The group earlier announced for profit of $265.8 million in FY 16, which is down from $293.6 million in the prior year. In FY 15, the figure included a special non-cash dividend of $31.9 million that the group received from the demerger of South32 from BHP Billiton. Therefore, excluding this item the profit was up 1.5%. Moreover, the one year portfolio return was negative 1.6%, and including franking it was positive 0.2%. Accordingly, AFI stock rose 2.5% in the last six months (as of November 14, 2016), and trading at a higher P/E. Going forward, the group is expecting the Australian economy to face more subdued growth rates over the medium term. AFI has increased the percentage of the portfolio invested in mid and small cap companies from 15% to 22% as large companies are facing competitive headwinds in a lower growth environment. The group is holding an information meeting for shareholders in Auckland on December 05, 2016. We give an “Expensive” recommendation on the stock at the current price of – $ 5.78
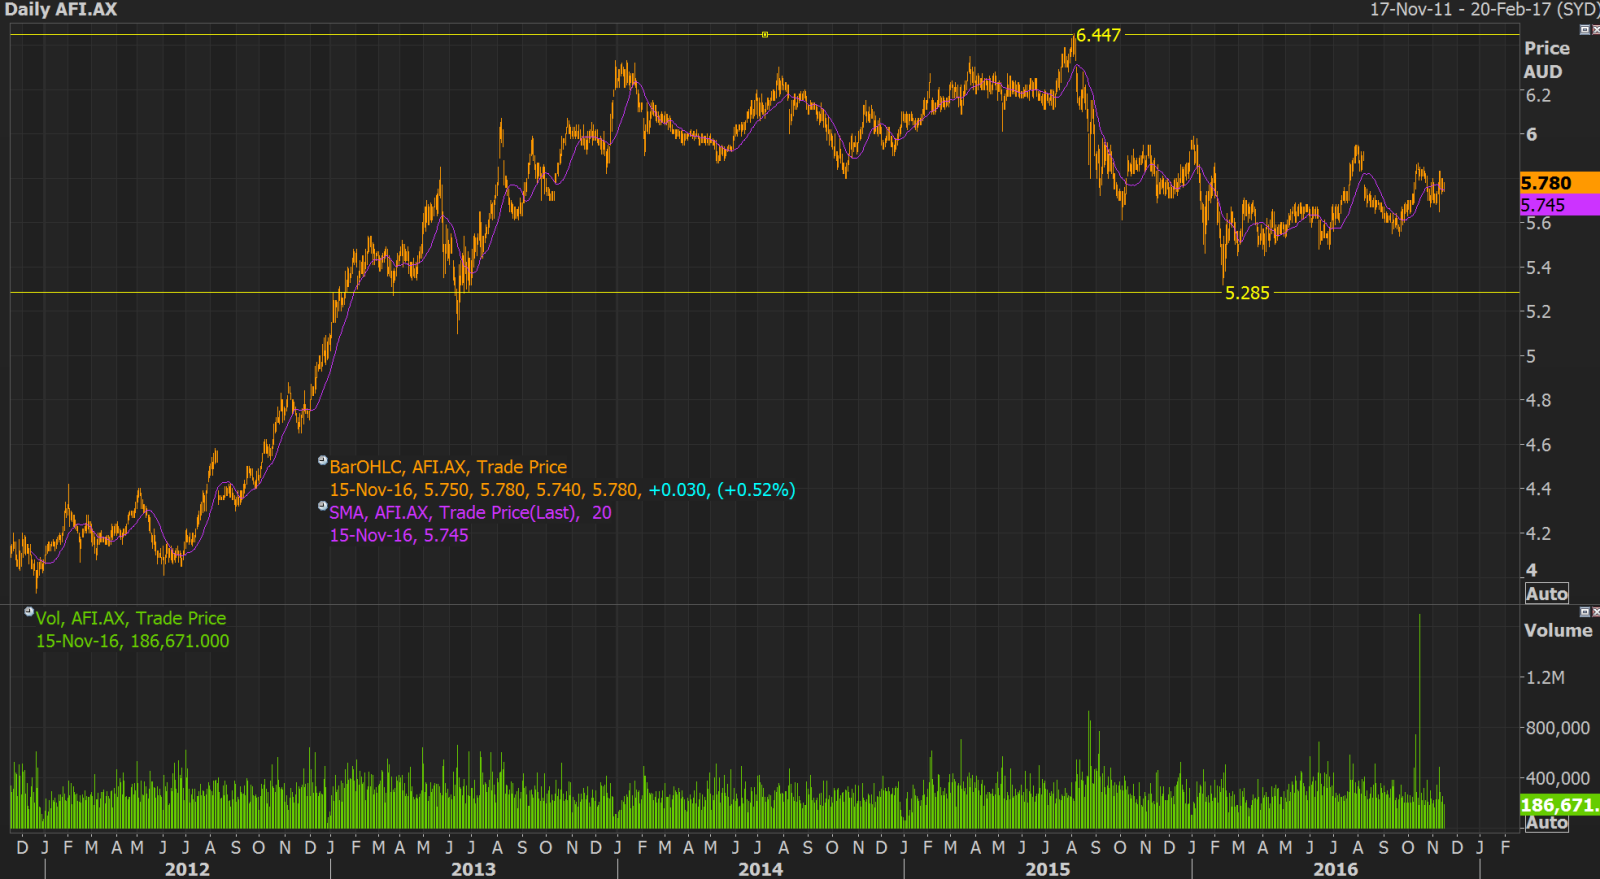
AFI Daily Chart (Source: Thomson Reuters)
Argo Investments Limited


ARG Details
Slight growth in net tangible asset backing: Argo Investments Limited (ASX: ARG) announced for fund raising of around $200 million through Share Purchase Plan (SPP) to acquire up to $15,000 of fully paid ordinary shares. Moreover, ARG reported a 5.2% fall in the profit to $216.3 million in FY 16 and a 6.7% fall in the earnings per share to 32 cents. The net tangible asset backing (NTA) per share fell 5.5% to $7.11. NTA as at October 31, 2016 was $7.17 per share.
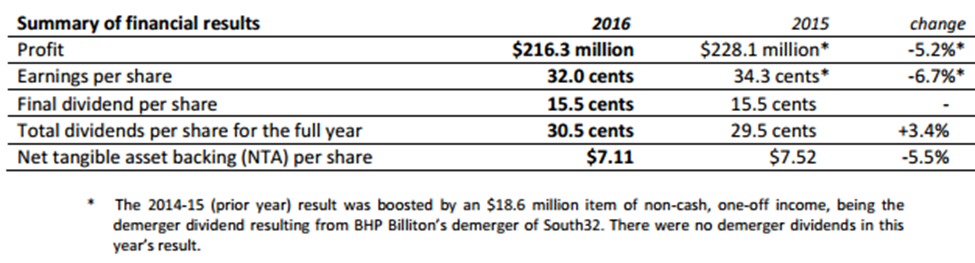

FY 16 Financial Performance (Source: Company Reports)
ARG stock fell 4.99% in the last three months (as of November 14, 2016), while still trading at a high P/E. We give an “Expensive” recommendation on the stock at the current price of – $ 7.28
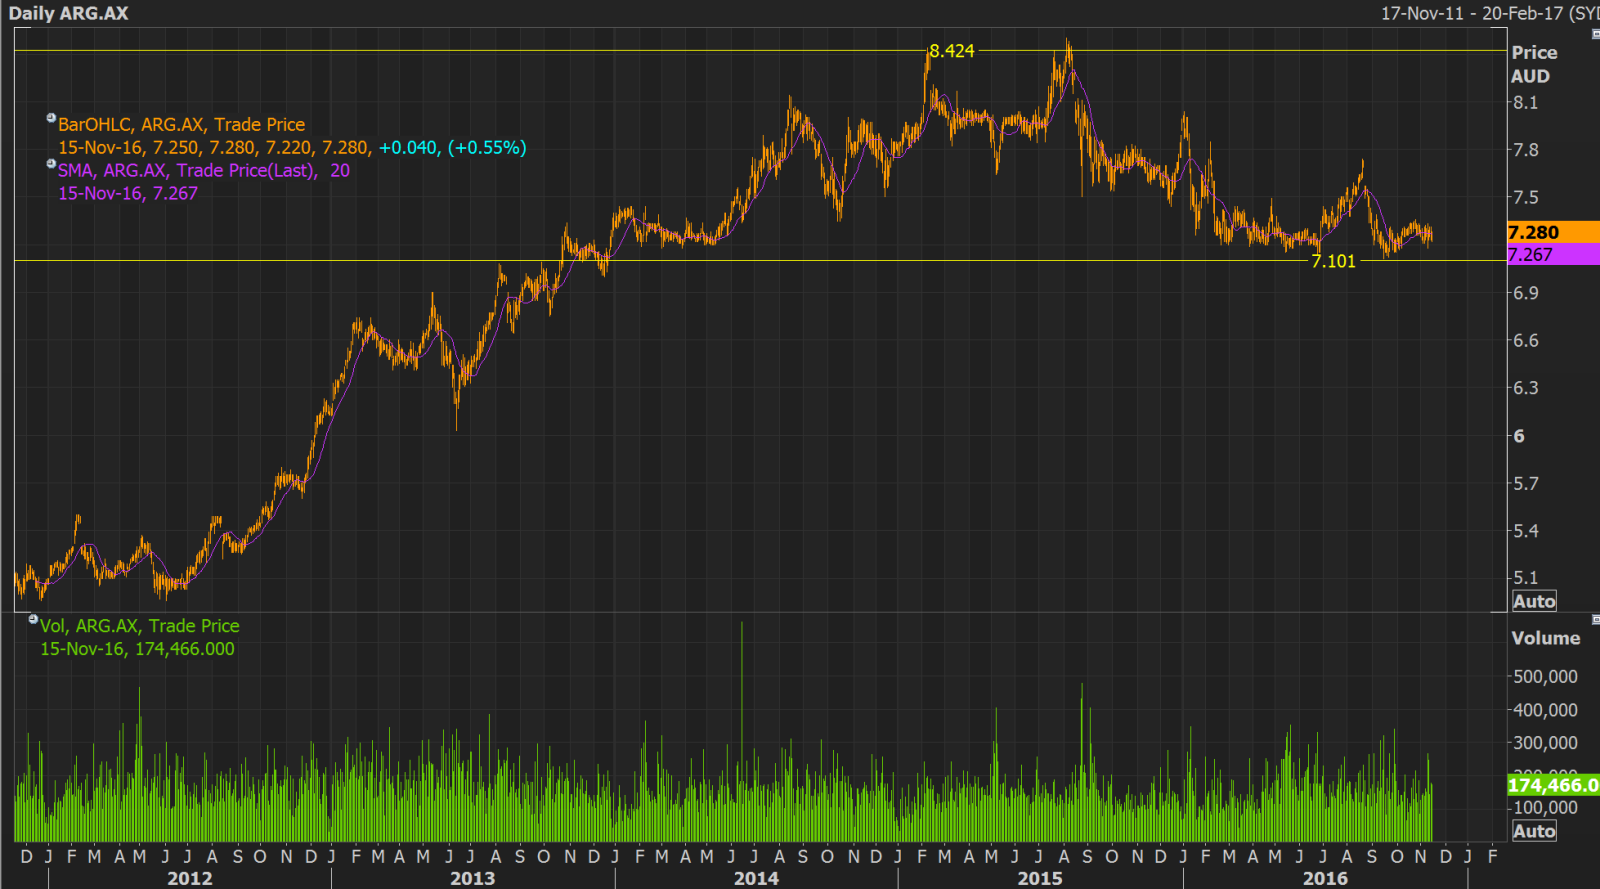
ARG Daily Chart (Source: Thomson Reuters)
Disclaimer
The advice given by Kalkine Pty Ltd and provided on this website is general information only and it does not take into account your investment objectives, financial situation or needs. You should therefore consider whether the advice is appropriate to your investment objectives, financial situation and needs before acting upon it. You should seek advice from a financial adviser, stockbroker or other professional (including taxation and legal advice) as necessary before acting on any advice. Not all investments are appropriate for all people. Kalkine.com.au and associated pages are published by Kalkine Pty Ltd ABN 34 154 808 312 (Australian Financial Services License Number 425376).The information on this website has been prepared from a wide variety of sources, which Kalkine Pty Ltd, to the best of its knowledge and belief, considers accurate. You should make your own enquiries about any investments and we strongly suggest you seek advice before acting upon any recommendation. Kalkine Pty Ltd has made every effort to ensure the reliability of information contained in its newsletters and websites. All information represents our views at the date of publication and may change without notice. To the extent permitted by law, Kalkine Pty Ltd excludes all liability for any loss or damage arising from the use of this website and any information published (including any indirect or consequential loss, any data loss or data corruption). If the law prohibits this exclusion, Kalkine Pty Ltd hereby limits its liability, to the extent permitted by law to the resupply of services. There may be a product disclosure statement or other offer document for the securities and financial products we write about in Kalkine Reports. You should obtain a copy of the product disclosure statement or offer document before making any decision about whether to acquire the security or product. The link to our Terms & Conditions has been provided please go through them and also have a read of the Financial Services Guide. On the date of publishing this report (mentioned on the website), employees and/or associates of Kalkine Pty Ltd currently hold positions in: BHP, BKY, KCN, PDN, and RIO. These stocks can change any time and readers of the reports should not consider these stocks as advice or recommendations.
 AU
AU
 Please wait processing your request...