SoFi Technologies, Inc
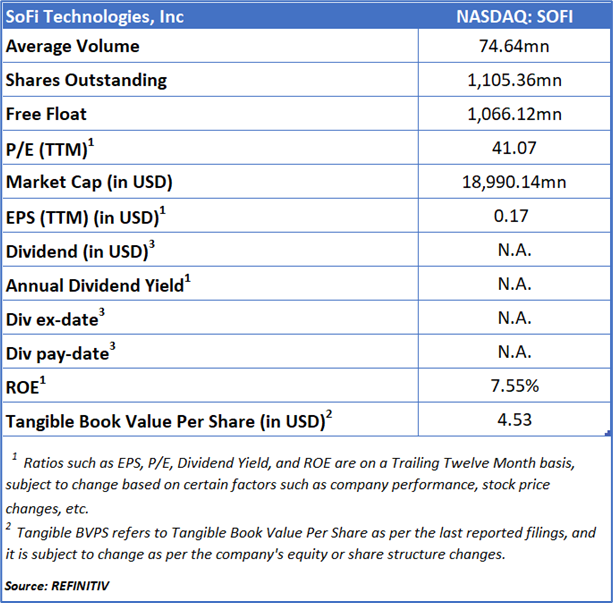
SoFi Technologies, Inc. (NASDAQ: SOFI) is a financial services provider that helps its members handle various aspects of their financial lives, offering products for borrowing, saving, spending, investing, and insurance. The company operates through three core segments: Lending, Technology Platform, and Financial Services. Its Lending segment delivers a variety of loan offerings, such as personal loans, student loans, and home mortgages, along with related support services. SoFi's platform supports the full lifecycle of these transactions, including credit application, underwriting, approval, funding, and ongoing loan management.
As per our previous American Tech Report published on ‘SOFI’ on 10th June, 2025, Kalkine provided an ‘Buy’ stance on the stock at USD 14.10 based on fundamental analysis and the stock price has now moved by ~ 35.89%since then and has breached resistance level 2.
Noted below are the details of support and resistance levels provided in our previous report:
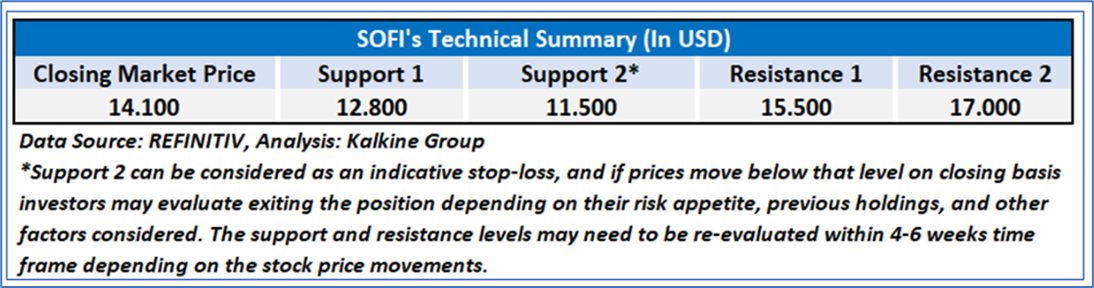
Rationale – Sell at USD 18.57
- Decline in GAAP Net Income: Despite strong revenue growth, SoFi reported a 19% year-over-year decline in GAAP net income, decreasing from USD88 million in Q1 2024 to USD71 million in Q1 2025. This decline in profitability, even amid record adjusted revenue and EBITDA performance, raises concerns over rising costs and margin pressures. It highlights that while the company is scaling its topline, maintaining profitability remains a challenge under GAAP standards.
- Margin Contraction in Lending Segment: SoFi’s lending segment contribution margin declined from 64% to 58%, suggesting increasing costs or lower pricing power. Although net interest income rose 35%, noninterest income fell 17%, indicating a shift in revenue composition. Directly attributable expenses also surged by 47%, putting downward pressure on the segment's overall margin. The reduced margin may imply greater competition, rising operational costs, or changes in loan mix and origination strategies.
- Sluggish Growth in Technology Platform: The Technology Platform segment posted modest revenue growth of just 10% year-over-year and nearly flat contribution profit growth of 1%, with a slight margin decline from 33% to 30%. This contrasts sharply with the high-growth performance in the Lending and Financial Services segments. The platform's relatively tepid performance, coupled with higher expenses, suggests challenges in expanding client base, monetizing capabilities, or effectively diversifying beyond traditional financial services customers.
- Ongoing Credit Risk and Default Exposure: While credit performance showed signs of improvement, SoFi continues to carry significant exposure to consumer credit risk, particularly in personal loans. The personal loan charge-off rate stood at 3.31%, and would have been closer to 4.8% without the sale of delinquent assets. Additionally, the company maintains a 7–8% lifetime loan loss assumption, which implies an acceptance of moderate-to-high risk. This level of risk tolerance could expose the company to higher defaults in a worsening macroeconomic environment or credit cycle downturn.
- Declining Contribution Margins and Operating Leverage Concerns: Despite record revenue, contribution margins declined or remained flat across segments, indicating that increased revenue has not translated proportionally into profitability. For example, in the Technology Platform and Lending segments, margins dropped year-over-year. Additionally, the Financial Services segment's contribution margin, although improved, still reflects significant cost increases. These dynamics point to challenges in achieving scalable operating leverage and optimizing cost structures, especially as the company continues to invest heavily in innovation and brand awareness.
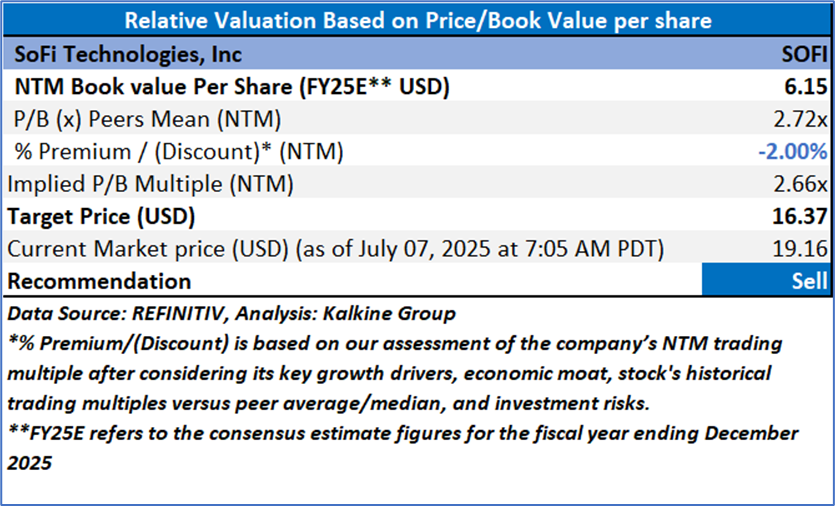
Valuation (Using Price/Book Multiple)
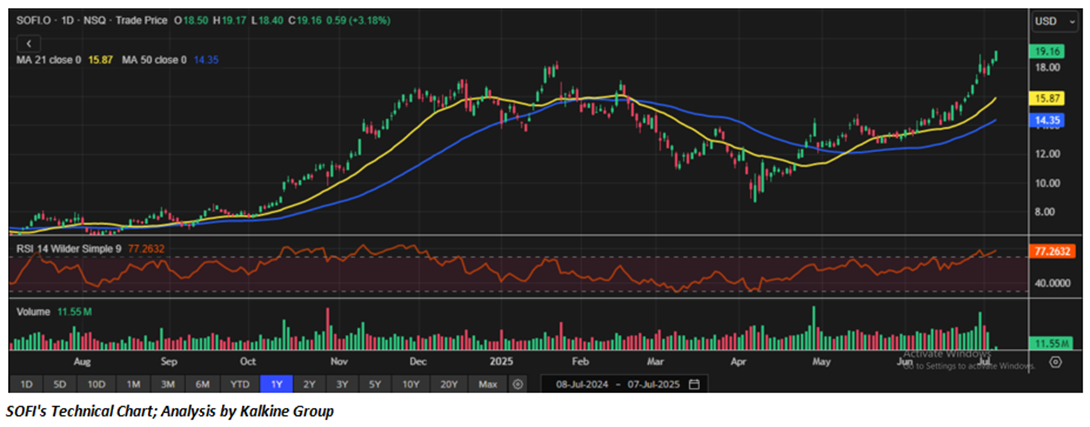
Share Price Chart
Conclusion
SoFi Technologies delivered strong top-line growth in Q1 2025, with record adjusted revenue, EBITDA, and robust expansion in members and products. Its Financial Services and Lending segments saw significant momentum, bolstered by product innovation and strong loan originations. However, profitability under GAAP declined, contribution margins compressed in key segments, and the Technology Platform showed only modest growth. While credit performance improved, SoFi's exposure to consumer lending risk remains notable. Overall, the company demonstrated solid growth and operational progress, though challenges in sustaining profitability and margin efficiency persist.
Based on the notional gains, valuation downside and price action stance, a "Sell" recommendation on SoFi Technologies, Inc. (NASDAQ: SOFI) has been given at the current market price of USD 19.16 as on 07 July 2025 at 7:05 AM PDT.
Note 1: Past performance is not a reliable indicator of future performance.
Note 2: The reference date for all price data, currency, technical indicators, support, and resistance level is 07 July 2025. The reference data in this report has been partly sourced from REFINITIV.
Note 3: Investment decisions should be made depending on an individual's appetite for upside potential, risks, holding duration, and any previous holdings. An 'Exit' from the stock can be considered if the Target Price mentioned as per the Valuation and or the technical levels provided has been achieved and is subject to the factors discussed above.
Note 4: Target Price refers to a price level which the stock is expected to reach as per the relative valuation method and/or technical analysis taking into consideration both short-term and long-term scenario.
Note 5: ‘Kalkine reports are prepared based on the stock prices captured either from the London Stock Exchange (LSE) and or REFINITIV. Typically, both sources (LSE and or REFINITIV) may reflect stock prices with a delay which could be a lag of 15-20 minutes. There can be no assurance that future results or events will be consistent with the information provided in the report. The information is subject to change without any prior notice.’
Note 6: Dividend Yield may vary as per the stock price movement.
 AU
AU

 Please wait processing your request...