This report is an updated version of the report published on 20 April 2026 at 9:42 PM EST.

USA Rare Earth, Inc. (NASDAQ: USAR)
USA Rare Earth, Inc. is a supplier of sintered neo magnets and other rare earth metals. The Company is engaged in developing a NdFeB magnet manufacturing plant in Stillwater, Oklahoma, and intends to establish domestic rare earth and critical minerals supply, extraction, and processing capabilities to both supply its magnet manufacturing plant and market surplus materials to third parties.
Recommendation Rationale – SELL at USD 22.52
- Trading Near Resistance Level: USAR’s share price surpassed its R2 level recommended on 15 April 2026. Therefore, share price can face resistance at the current levels.
- Increase in Operating Expenses: Total operating expenses rose to USD 59.7 million in FY25 from USD 15.6 million in FY24, indicating higher cost base and pressure on operating margins.
- Higher Net Loss: Net loss increased to USD 298.5 million in FY25 from USD 16.4 million in FY24, reflecting no operating revenue and continued pressure on overall profitability.
- Overvalued Multiples: On a trailing 12-month basis, USAR shares are trading at a price/book multiple of 9.8x vs industry (Metals & Mining)) median of 2.7x, hence the stock looks overvalued.
- Technical Standpoint: USAR stock appears technically stretched, with the stock rallying sharply above its 21-day and 50-day moving averages. RSI (14-day) near ~70 indicates overbought conditions, raising the risk of a near-term pullback. While momentum is positive, failure to sustain above recent highs could trigger profit booking, with downside support seen around the USD 18.5–17 range (key moving averages).
- Operational Risk: Profitability depends on successful ramp-up of operations, with execution risks potentially affecting timelines and output, while continued losses and negative EBITDA reflect high upfront costs. Significant funding requirements may persist, increasing reliance on external capital and placing pressure on financial flexibility.
USAR Daily Price Chart
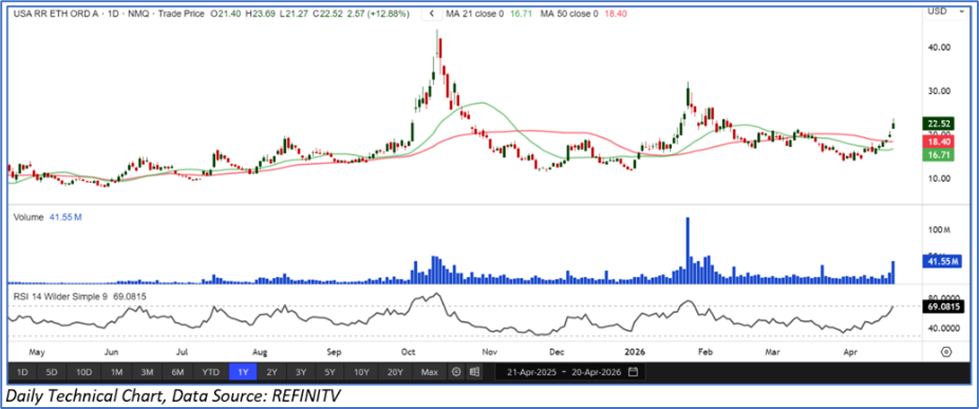
Given that the stock has moved above its R2 level, recent rally in the share price, and risks associated, it is prudent to sell the stock at the current levels. Hence, a ‘Sell’ recommendation is given on the stock at the closing market price of USD 22.52, as of 20 April 2026.
USA Rare Earth, Inc. (NASDAQ: USAR) is a part of Global Green Energy Portfolio.
Markets are trading in a highly volatile zone currently due to certain macro-economic issues and prevailing geopolitical tensions. Therefore, it is prudent to follow a cautious approach while investing.
Note 1: Past performance is neither an indicator nor a guarantee of future performance.
Note 2: The reference date for all price data, currency, technical indicators, support, and resistance levels is 20 April 2026. The reference data in this report has been partly sourced from REFINITIV.
Note 3: Investment decisions should be made depending on an individual's appetite for upside potential, risks, holding duration, and any previous holdings. An 'Exit' from the stock can be considered if the Target Price mentioned as per the Valuation and or the technical levels provided has been achieved and is subject to the factors discussed above.
Note 4: Kalkine reports are prepared based on the stock prices captured either from REFINITIV or Trading View. Typically, REFINITIV or Trading View may reflect stock prices with a delay which could be a lag of 25-30 minutes. There can be no assurance that future results or events will be consistent with the information provided in the report. The information is subject to change without any prior notice.
Technical Indicators Defined: -
Support: A level at which the stock prices tend to find support if they are falling, and downtrend may take a pause backed by demand or buying interest.
Resistance: A level at which the stock prices tend to find resistance when they are rising, and uptrend may take a pause due to profit booking or selling interest.
Stop-loss: In general, it is a level to protect further losses in case of any unfavourable movement in the stock prices.

 CA
 NZ
 UK
 US
 IND

 AU

 Please wait processing your request...