This report is an updated version of the report published on 27 March 2026 at 11:31 AM AEDT.

Emyria Limited (ASX: EMD)
Emyria Limited (ASX: EMD) is an Australian company focused on developing innovative treatments for unmet needs in mental health and neurological conditions. Its pipeline includes MDMA-inspired compounds such as EMD-MX1, a fast-acting therapy with an improved side-effect profile for drug-assisted treatments; EMD-MX2, designed to reduce side effects of standard Parkinson’s disease therapies; and EMD-MX3, targeting additional neurological disorders.
Recommendation Rationale – SELL at AUD 0.049
- Surpassed Resistance Level: EMD’s share price has surpassed its R2 level, recommended on 26 March 2026. Therefore, share price can face resistance at the current levels.
- Technical Commentary: While undergoing a short-term downtrend, EMD’s stock price is approaching a significant resistance established by the December 2025 trough, anticipating a potential correction. Moreover, the stock is trading near the upper boundary of a descending wedge pattern, reinforcing the previous observation. The stock is currently trading between its previous peak and trough, which serve as immediate resistance and support levels, respectively.
- Increase in Losses: During 1HFY26, the Group’s net loss widened by approximately 145% YoY. Losses increased due to continued investment in the company’s national expansion infrastructure and the scaling of its clinical workforce across three states.
- Emerging Risks: EMD faces risks from regulatory approvals, delays in clinic rollout, and slower-than-expected patient uptake. Dependence on insurer-funded treatments, workforce scalability challenges, and execution risks in expanding the Empax network may impact revenue growth and operational performance.
EMD Daily Chart
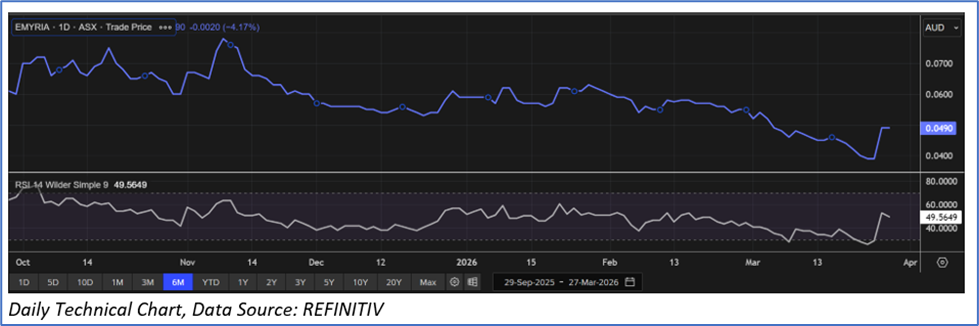
Considering that the stock has surpassed its R2 level, macroeconomic uncertainty, current trading level, and risks associated, the stock can face consolidation at the current levels. Hence, a ‘Sell’ recommendation is given on the stock at the current price of AUD 0.0490, at 10:05 AM AEDT, as of 27 March 2026.
Markets are trading in a highly volatile zone currently due to certain macro-economic issues and geopolitical tensions prevailing. Therefore, it is prudent to follow a cautious approach while investing.
Note 1: Past performance is neither an indicator nor a guarantee of future performance.
Note 2: The reference date for all price data, currency, technical indicators, support, and resistance levels is 27 March 2026. The reference data in this report has been partly sourced from REFINITIV.
Note 3: Investment decisions should be made depending on an individual's appetite for upside potential, risks, holding duration, and any previous holdings. An 'Exit' from the stock can be considered if the Target Price mentioned as per the Valuation and or the technical levels provided has been achieved and is subject to the factors discussed above.
Note 4: Kalkine reports are prepared based on the stock prices captured either from REFINITIV or Trading View. Typically, REFINITIV or Trading View may reflect stock prices with a delay which could be a lag of 25-30 minutes. There can be no assurance that future results or events will be consistent with the information provided in the report. The information is subject to change without any prior notice.
Technical Indicators Defined: -
Support: A level at which the stock prices tend to find support if they are falling, and a downtrend may take a pause backed by demand or buying interest. Support 1 refers to the nearby support level for the stock and if the price breaches the level, then Support 2 may act as the crucial support level for the stock.
Resistance: A level at which the stock prices tend to find resistance when they are rising, and an uptrend may take a pause due to profit booking or selling interest. Resistance 1 refers to the nearby resistance level for the stock and if the price surpasses the level, then Resistance 2 may act as the crucial resistance level for the stock.
Stop-loss: It is a level to protect further losses in case of unfavourable movement in the stock prices.

 CA
 NZ
 UK
 US
 IND

 AU

 Please wait processing your request...