.png)
Stocks’ Details
National Australia Bank Limited
CET1 Ratio up by 20 BPS:National Australia Bank Limited (ASX: NAB) is an Australian banking company, which is engaged in providing banking, financial and related services. The market capitalisation of the bank stood at $78.08 Bn as on 14th February 2020.
Trading Update for Q1 FY20: During the period, unaudited cash earnings came in at $1.65 billion, up 1% y-o-y. Revenue for the period increased less than 1% primarily indicating a marginally higher net interest margin. Net interest margin profited from home loan repricing, which offset the impact of a low interest rate environment. The company’s operating expenses increased by 3%, primarily due to higher investment and higher compensation expenses. Statutory net profit for the period stood at $1.7 billion. CET1 (Common Equity Tier 1) stood at 10.6% as at 31 December 2019, which increased from 10.4% as at September 2019.
.png)
1QFY20 Financial Highlights (Source: Company Reports)
Liquidity highlights: The liquidity coverage ratio as at 31 December 2019 was 129%. The company reported a total cash outflow of $113 billion, with total liquid asset amounting to $146.1 billion. Leverage ratio on APRA basis stood at 5.6%.
Valuation Methodology: P/B Based Valuation
.png)
P/B Based Valuation (Source: Thomson Reuters)
Note: All forecasted figures have been taken from Thomson Reuters, NTM: Next Twelve Months
Stock Recommendation: In the recent 1QFY20 trading update, the bank has improved its financials as well as its capital position. As per ASX, the stock of NAB is trading close to the average of its 52-week low and high of $23.890 and $30.00, respectively. We have valued the stock using P/B based relative valuation method, and for the said purpose, we have considered peers like Westpac Banking Corp (ASX: WBC), Commonwealth Bank of Australia (ASX: CBA) and Bank of Queensland Ltd (ASX: BOQ), to name few. Therefore, we have arrived at a target price with an upside of single-digit (in percentage terms). Thus, considering the decent valuation and strong capital position, we give a “Hold” recommendation on the stock at the current market price of $27.35 per share, up 3.247% on 14 February 2020.
ASX Limited
Revenues Increased 7.1% Year Over Year in 1HFY20: ASX Limited (ASX: ASX) is engaged in offering a wide range of financial market services across multiple asset classes-equities, fixed income, derivatives and managed funds.
1HFY20 Key Highlights for the Period Ended 31st December 2019: Operating revenue for the period increased by 7.1% to $454.9 Mn, reflecting broad-based growth across all our business areas. EBIT increased by 6% to $315.1 Mn. Total expenses for the period decreased 9.8% year over year to $139.8 million. NPAT for the period stood at $250.4 Mn, up 1.8% year over year, on the back of diversified business growth. Earnings per share came in at 129.3 cents per share, up 1.7% year over year. An interim dividend of 116.4 cents per share has been declared during the period, up 1.7% year over year.
.png)
1HFY20 Financial Highlights (Source: Company Reports)
What to Expect: For FY20, the company expects total expenditure to grow in the range of 6-8%. In FY20, the company predicts to experience increased volatility due to the geopolitical situation and changing expectations for interest rates. The company remains on track to stay focused on the execution of strategic initiatives, which includes upgradation of technology, focusing on customer satisfaction and create solutions for the advantage of users and the broader industry.
Valuation Methodology: P/BV Based Valuation
.png)
P/BV Based Valuation (Source: Thomson Reuters)
Note: All forecasted figures have been taken from Thomson Reuters, NTM: Next Twelve Months
Stock Recommendation: As per the ASX, the stock has gained 24.28% in the past one year. The stock is currently trading above the average of its 52-week high and low of $63.822 - $88.316 with a price to earnings multiple of 32.66x, and an annual dividend yield of 2.76%. We have valued the stock using P/BV based relative valuation method, and for the said purpose, we have considered peers like Computershare Ltd (ASX: CPU), Link Administration Holdings Ltd (ASX: LNK) and Perpetual Ltd (ASX: PPT), to name few. Therefore, we have arrived at a target price offering a downside of single-digit (in percentage terms). Hence, considering the aforesaid facts and current trading levels, we give an “Expensive” rating on the stock at the current market price of $82.25 per share, down 1.732% on 14 February 2020.
AMP Limited
Higher Investment & Transformational Strategy are Key Positives: AMP Limited (ASX: AMP) provides superannuation, pension, life insurance, and other financial services in ANZ. The company has a market capitalisation of $6.24 Bn as on 14 February 2020.Recently, the company announced that it will distribute a dividend of $0.9599 per share on the security, AMPPB - CAP NOTE 3-BBSW+4.50% PERP NON-CUM RED T-12-25, with an ex-date of March 5, 2020 and payment date of March 16, 2020. In another update, the companystated that Mike Wilkins AO will step down from the Board, and Michael Sammells will be appointed as a Non-Executive Director of the company.
FY19 Key Highlights: Its retained businesses operating earnings decreased by 22.7% year over year to $565 Mn in FY19. Its underlying profit decreased by 31.8% to $464 Mn from $690 Mn in FY18. The major reason behind the result can be attributed to considerable non-cash impairment taken in 1H19 to address legacy issues coupled with higher regulatory and compliance costs. Total net cash outflow in FY19 stood at $6.3 million.
.png)
FY19 Income Statement (Source: Company Reports)
What to expect: AMP remains on track to launch three-year transformational strategytowards a client-led, simpler and growth-oriented business.Its $1.0-1.3 billion investment program is expected to de-risk the business and drive growth while significantly reducing costs. The company expects FY20 controllable cost excluding AMPC to be at ~810 million.
Valuation Methodology: P/E Based Valuation
.png)
P/E Based Valuation (Source: Thomson Reuters)
Note: All forecasted figures have been taken from Thomson Reuters, NTM: Next Twelve Months
Stock Recommendation: AMP is presently trading towards the lower band of its 52-week trading range of $1.570-$2.460. Its debt to equity for FY19 stood at 4.76x, higher than the industry median of 2.21x, which implies that the company is highly leveraged than its peer group. We have valued the stock using P/E based relative valuation method, and for the said purpose, we have considered peers like Suncorp Group Ltd (ASX: SUN), QBE Insurance Group Ltd (ASX: QBE) and IOOF Holdings Ltd (ASX: IFL). Therefore, we have arrived at a target price offering limited upside (in percentage terms). Hence, considering the aforesaid facts and current trading levels, we have a watch stance on the stock at the current market price of $1.825 per share, down 0.551% as on 14 February 2020.
Magellan Financial Group Limited
NPAT up 24% Year Over Year in 1HFY20: Magellan Financial Group Limited (ASX: MFG) is involved in the fund management business to provide investment funds to high net worth & retail investors in ANZ and institutional investors internationally. Recently, the company announced a dividend of $0.929 per share on the security, MFG - ORDINARY FULLY PAID, with an ex-date of February 18, 2020 and payment date of February 27, 2020.
1HFY20 Key Highlights for the Period Ending 31 December 2019: The company reported adjusted revenue of $337 million, up 22% from 1HFY19 and net profit after tax of $195.7 million as compared to $173.5 million during the previous corresponding period. The company reported Average Funds Under Management at $92.8 billion, which increased 29% year over year. The company declared an interim dividend of 92.9 cents, with adjusted EPS coming to 119.9 cents in the said period.
.png)
1HFY20 Financial Highlights (Source: Company Reports)
Outlook: As per the Management Guidance, Funds Management segment expenses in FY20 is expected to be at the top end of the guided range of $115-$120 million.
Stock Recommendation: The market capitalisation of the company stood at ~$13.04 Bn as on 14 February 2020. The stock has generated returns of 144.97% in the past one year. The stock is quoting at a price to earnings multiples of 33.57x, with an annual dividend yield of 2.86%. The business has delivered decent financial numbers and the stock price has moved accordingly. On the valuation front, the stock is trading at an EV/EBITDA multiple of 25.5x as compared to the industry average of 13.4x on TTM (Trailing Twelve Months) basis.Hence, considering the aforesaid facts and current trading levels, we have a watch stance on the stock at the current market price of $73.67 per share, up 2.992% as on 14 February 2020.
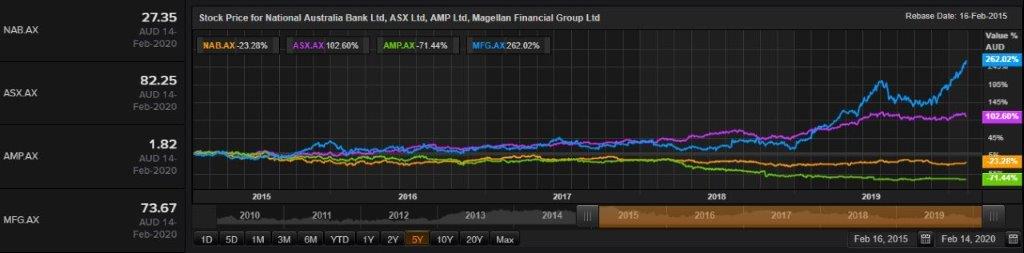
Comparative Price Chart (Source: Thomson Reuters)
Disclaimer
The advice given by Kalkine Pty Ltd and provided on this website is general information only and it does not take into account your investment objectives, financial situation or needs. You should therefore consider whether the advice is appropriate to your investment objectives, financial situation and needs before acting upon it. You should seek advice from a financial adviser, stockbroker or other professional (including taxation and legal advice) as necessary before acting on any advice. Not all investments are appropriate for all people. Kalkine.com.au and associated pages are published by Kalkine Pty Ltd ABN 34 154 808 312 (Australian Financial Services License Number 425376). The information on this website has been prepared from a wide variety of sources, which Kalkine Pty Ltd, to the best of its knowledge and belief, considers accurate. You should make your own enquiries about any investments and we strongly suggest you seek advice before acting upon any recommendation. Kalkine Pty Ltd has made every effort to ensure the reliability of information contained in its newsletters and websites. All information represents our views at the date of publication and may change without notice. To the extent permitted by law, Kalkine Pty Ltd excludes all liability for any loss or damage arising from the use of this website and any information published (including any indirect or consequential loss, any data loss or data corruption). If the law prohibits this exclusion, Kalkine Pty Ltd hereby limits its liability, to the extent permitted by law to the resupply of services. There may be a product disclosure statement or other offer document for the securities and financial products we write about in Kalkine Reports. You should obtain a copy of the product disclosure statement or offer document before making any decision about whether to acquire the security or product. The link to our Terms & Conditions has been provided please go through them and also have a read of the Financial Services Guide. On the date of publishing this report (mentioned on the website), employees and/or associates of Kalkine Pty Ltd do not hold positions in any of the stocks covered on the website. These stocks can change any time and readers of the reports should not consider these stocks as advice or recommendations.
 AU
AU

 Please wait processing your request...