RTX Corporation
RTX Corporation (NYSE: RTX) is a global aerospace and defense company that delivers advanced systems and services to commercial, military, and government customers. It operates through three segments: Collins Aerospace, which provides aerospace systems and aftermarket services; Pratt & Whitney, which manufactures aircraft engines across aviation segments; and Raytheon, which focuses on advanced defense technologies including missile systems, air and missile defense, and threat detection solutions.

Result Update for the quarter ended 31 March 2026 (Q1FY26)
- Strong Start to FY26 with Broad-Based Growth: RTX delivered a robust financial performance in the first quarter of 2026, supported by strong execution across its diversified portfolio. The company reported sales of USD 22.1 billion, reflecting a 9% year-on-year increase and 10% organic growth, driven by sustained demand across both commercial aerospace and defense markets. Adjusted earnings per share rose sharply by 21% to USD 1.78, highlighting improved operational efficiency and favorable business mix.
- Profitability Expansion Supported by Operating Leverage: The company recorded net income attributable to shareholders of USD 2.1 billion, marking a significant increase from the prior year. Adjusted net income stood at USD 2.4 billion, reflecting a 22% rise, primarily driven by higher segment operating profits across all business divisions. Margin expansion was supported by strong volume growth and disciplined cost management, although partially offset by higher tariffs and operating expenses in certain segments.
- Healthy Cash Flow Generation and Liquidity Position: RTX demonstrated strong cash generation during the quarter, with operating cash flow of USD 1.9 billion and free cash flow of USD 1.3 billion. The improvement in cash flows was supported by higher earnings and efficient working capital management, reinforcing the company’s ability to fund investments, shareholder returns, and strategic initiatives.
- Collins Aerospace Driven by Commercial and Defense Demand: The Collins Aerospace segment reported sales of USD 7.6 billion, reflecting a 5% increase year-on-year. Growth was driven by higher commercial OEM volumes, increased aftermarket activity, and stronger defense demand across multiple programs. Operating profit rose significantly, supported by improved volume leverage and lower R&D expenses, although partially offset by unfavorable product mix and tariff impacts.
- Pratt & Whitney Benefits from Aftermarket Strength: Pratt & Whitney delivered strong performance, with revenue increasing 11% year-on-year to USD 8.2 billion. The growth was primarily driven by a sharp rise in commercial aftermarket activity and higher military engine production, particularly for the F135 program. Operating profit improved materially due to higher volumes, although cost pressures, including tariffs and increased SG&A expenses, moderated the overall margin expansion.
- Raytheon Segment Strengthened by Defense Programs: The Raytheon segment reported revenue of USD 6.9 billion, up 10% year-on-year, supported by strong demand for land and air defense systems and naval munitions programs. Operating profit increased significantly, benefiting from favorable program mix, improved productivity, and higher volumes across key defense platforms.
- Operational Momentum and Strategic Execution: Operationally, RTX continued to scale production and invest in future capabilities. The company increased munitions output by over 40% year-on-year and expanded maintenance, repair, and overhaul (MRO) capacity, with PW1100 output rising 23%. Additionally, ongoing investments in next-generation technologies, including hybrid-electric propulsion and autonomous systems, highlight its focus on long-term innovation and capacity expansion.
- Raised Outlook Reflects Confidence in Growth Trajectory: Based on strong first-quarter performance and sustained demand visibility, RTX raised its full-year 2026 guidance. The company now expects adjusted sales in the range of USD 92.5–93.5 billion and adjusted EPS of USD 6.70–6.90, while maintaining its free cash flow outlook. The upward revision reflects confidence in continued execution, backlog conversion, and favorable industry dynamics.
Key Risks:
- Supply Chain and Cost Pressures: Dependence on global suppliers and exposure to tariffs and input cost inflation may impact margins and production timelines
- Program Execution and Technical Risks: Challenges in engine programs, including inspection cycles and performance issues, could disrupt deliveries and increase costs
- Defense Budget Sensitivity: A significant portion of revenue is tied to government defense spending, making performance vulnerable to policy shifts and funding changes
- Commercial Aerospace Cyclicality: Demand fluctuations in commercial aviation, particularly OEM deliveries, may affect revenue visibility and growth consistency.
Technical Observation (on the daily chart):
- The stock exhibited a sustained uptrend from mid-2025 to early 2026, forming a pattern of higher highs and higher lows. However, the recent price action indicates a loss of momentum, with the trend transitioning into a sideways-to-downward phase.
- The price has recently broken below both the 20-day (USD 195.63) and 50-day (USD 199.87) moving averages, signaling short-term bearishness. The flattening of these averages further suggests weakening trend strength.
- The RSI is around 18, indicating a deep oversold condition. While this suggests the possibility of a short-term technical bounce, it also reflects strong selling pressure in the current phase.
- Recent declines have been accompanied by relatively elevated volumes, indicating distribution and increased selling interest, which reinforces the near-term bearish bias.
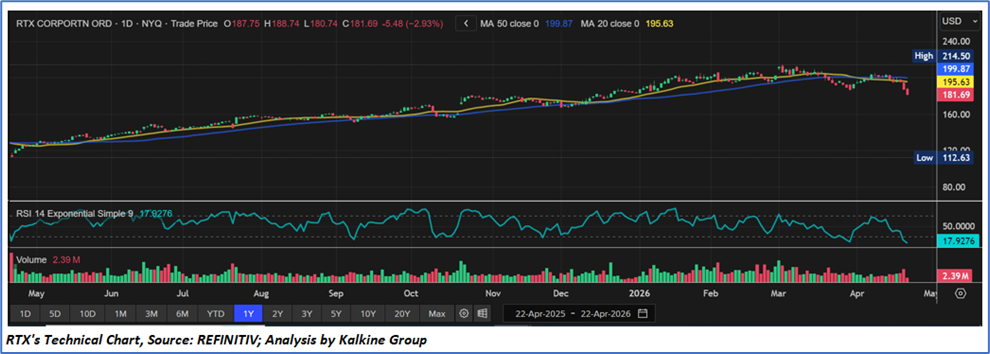
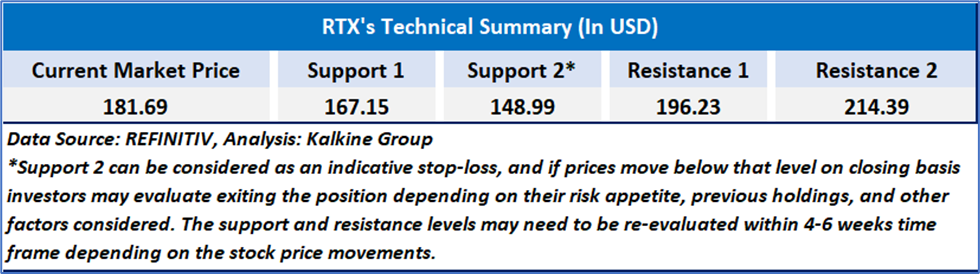
As per the above-mentioned price action, recent key business and financial updates, momentum in the stock over the last month, and technical indicators analysis, a ‘Watch’ rating has been RTX Corporation (NYSE: RTX) at the current market price of USD 181.69 as of April 22,2026 at 7:55 am PDT.
Individuals can evaluate the stock based on the support and resistance levels provided in the report in case of keen interest taking into consideration the risk-reward scenario.
Markets are trading in a highly volatile zone currently due to certain macro-economic issues and prevailing geopolitical tensions. Therefore, it is prudent to follow a cautious approach while investing.
Related Risk: This report may be looked at from a high-risk perspective and a recommendation is provided for a short duration. This report is solely based on technical parameters, and the fundamental performance of the stocks has not been considered in the decision-making process. Other factors which could impact the stock prices include market risks, regulatory risks, interest rates risks, currency risks, social and political instability risks etc.
Note 1: Past performance is not a reliable indicator of future performance.
Note 2: The reference date for all price data, currency, technical indicators, support, and resistance level is April 22,2026. The reference data in this report has been partly sourced from REFINITIV.
Note 3: Investment decisions should be made depending on an individual's appetite for upside potential, risks, holding duration, and any previous holdings. An 'Exit' from the stock can be considered if the Target Price mentioned as per the Valuation and or the technical levels provided has been achieved and is subject to the factors discussed above.
Note 4: Target Price refers to a price level that the stock is expected to reach as per the relative valuation method and or technical analysis taking into consideration both short-term and long-term scenarios.
Note 5: ‘Kalkine reports are prepared based on the stock prices captured either from the New York Stock Exchange (NYSE), NASDAQ Capital Markets (NASDAQ), and or REFINITIV. Typically, all sources (NYSE, NASDAQ, or REFINITIV) may reflect stock prices with a delay which could be a lag of 15-20 minutes. There can be no assurance that future results or events will be consistent with the information provided in the report. The information is subject to change without any prior notice.

 CA
 NZ
 UK
 US
 IND

 AU

 Please wait processing your request...