Zenas BioPharma, Inc. (NASDAQ: ZBIO)a
Zenas BioPharma, Inc. (NASDAQ: ZBIO) is a clinical-stage global biopharmaceutical company focused on the development and commercialization of transformative therapies for patients with autoimmune diseases. The Company's lead product candidate, obexelimab, is a bifunctional monoclonal antibody designed to bind both CD19 and FcyRIIb, which are broadly present across B cell lineage, to inhibit the activity of cells that are implicated in many autoimmune diseases without depleting them.

Key Business and Financial Updates:
- Revenue and Collaboration Income Trends: During Q3 FY25, Zenas BioPharma Inc. reported revenue of USD 0.6 million, consistent with its development-stage operational profile. This revenue stemmed primarily from collaboration and licensing arrangements, as the company has not yet generated product sales. Compared with USD 0.6 million in Q3 FY24, reported revenue remained stable year-over-year, reflecting continued monetization of non-commercial assets. The absence of recurring commercialization revenue underscores the company’s focus on clinical progress rather than market sales at this stage.
- Research & Development (R&D) Expense and Operating Loss: ZBIO’s R&D expenditure totaled USD 22.4 million in Q3 FY25, up from USD 18.7 million in the same quarter of the prior fiscal year, driven by increased clinical trial activity, manufacturing readiness efforts, and expanded regulatory engagement. General & Administrative (G&A) expense was USD 6.9 million, compared with USD 6.1 million in Q3 FY24, indicating controlled overhead growth relative to research investment. The company reported an operating loss of USD 28.7 million, widening from an operating loss of USD 24.8 million in Q3 FY24, reflecting the strategic allocation of capital toward pipeline advancement rather than revenue generation.
- Net Loss, Earnings Per Share, and Cash Position: For Q3 FY25, ZBIO reported a net loss of USD 28.5 million, compared with a net loss of USD 24.6 million in Q3 FY24, largely due to higher R&D expenditure. Net loss per diluted share was USD 0.47, versus USD 0.41 in the prior-year quarter. On a liquidity basis, the company ended the quarter with USD 112.3 million in cash and cash equivalents, providing runway coverage for ongoing clinical programs. Operating activities absorbed USD 25.8 million in cash, moderately higher than prior periods, reflecting timing of clinical spend and upfront R&D investments.
- Pipeline Progress Metrics and Clinical Development Milestones: ZBIO continued to advance its lead immunology therapeutic through Phase 2/3 development, with enrollment targets progressing and future data readouts scheduled. Patient dosing increased by 18% quarter-over-quarter, and key regulatory submissions were prepared in alignment with anticipated milestone windows. The company also expanded its manufacturing scale-up efforts, entering a commercial supply agreement that could unlock up to USD 15 million in near-term non-dilutive funding upon regulatory achievement. While not yet revenue-generating from product sales, these pipeline metrics and strategic partnerships contribute to measurable clinical and commercial development visibility.
Key Company specific risks for ZBIO:
- Clinical Development and Regulatory Approval Risk: As a clinical-stage biotechnology company, Zenas BioPharma Inc. remains heavily dependent on the successful progression of its lead immunology candidate through Phase 2/3 trials and subsequent regulatory review. Any delay in patient enrollment, adverse safety findings, failure to meet primary endpoints, or regulatory setbacks could materially impact valuation and delay commercialization timelines. Given the binary nature of late-stage clinical readouts, negative or inconclusive data could significantly impair pipeline value.
- Cash Burn and Capital Raising Risk: ZBIO continues to report recurring quarterly net losses driven by elevated R&D expenditure. With no approved products generating recurring revenue, the company relies on its cash reserves and potential capital markets access to fund operations. Sustained operating cash outflows increase the likelihood of future equity issuance or strategic financing, which could result in shareholder dilution. Funding conditions within the broader biotechnology capital markets environment therefore represent a material financial risk.
- Commercialization and Competitive Landscape Risk: Even if regulatory approval is achieved, ZBIO faces execution risk related to market entry, pricing dynamics, reimbursement approvals, and competitive positioning within the immunology therapeutic landscape. Larger, well-capitalized pharmaceutical competitors may offer alternative treatments with established market share, potentially limiting adoption. Additionally, evolving regulatory frameworks and pricing scrutiny in major markets could pressure long-term commercial margins and market penetration rates.
Technical Observation (on the daily chart):
- Trend Structure and Moving Average Configuration Reflect Reacceleration Within Broader Uptrend: Zenas BioPharma Inc. remains within a broader medium-term uptrend despite a prior pullback from its USD 44.60 high. The stock is trading near USD 26.77 and has reclaimed its 21-day moving average (USD 21.38), signaling short-term momentum improving. However, price is approaching the 50-day moving average (USD 27.65), which acts as key intermediate resistance. A sustained move above this level would be required to confirm a renewed bullish phase rather than a temporary rebound within consolidation.
- Momentum Indicators Signal Strengthening Accumulation Without Overextension: The RSI near 59.7 indicates strengthening buying pressure and a shift back into positive momentum territory. Importantly, the indicator remains below overbought levels, suggesting further upside potential before technical exhaustion risks emerge. Volume patterns show constructive participation during recent advances, supporting the credibility of the recovery move.
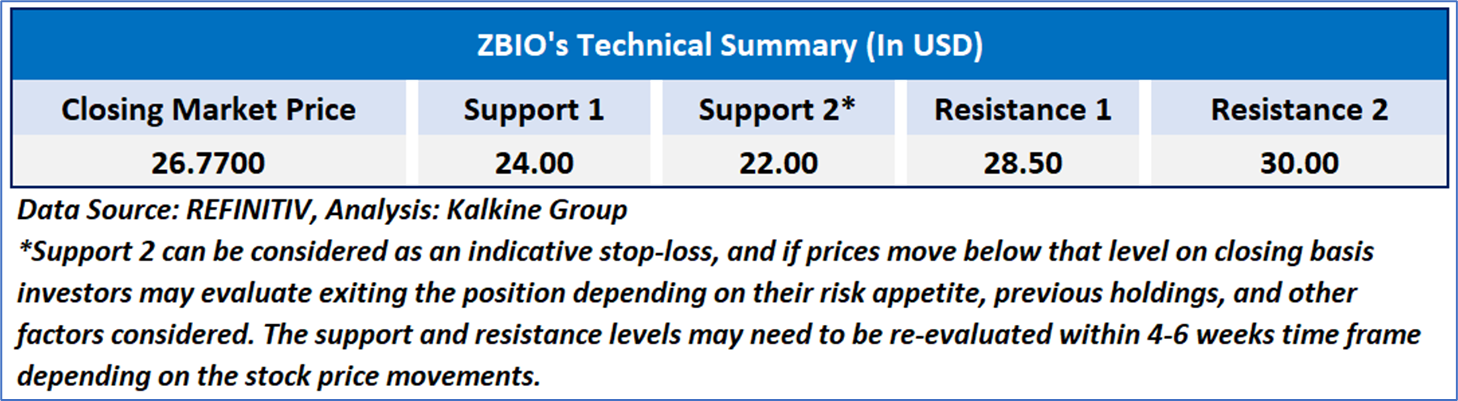
- Key Resistance and Support Levels Define Critical Inflection Zone: Immediate resistance is positioned near USD 27.65, aligned with the 50-day moving average. A breakout above this zone would improve the intermediate technical outlook. On the downside, near-term support lies around USD 21.00–22.00, while stronger structural support is visible near USD 16.00–18.00. Overall, the stock appears to be in a stabilization-to-recovery phase, with confirmation dependent on sustained strength above key resistance.
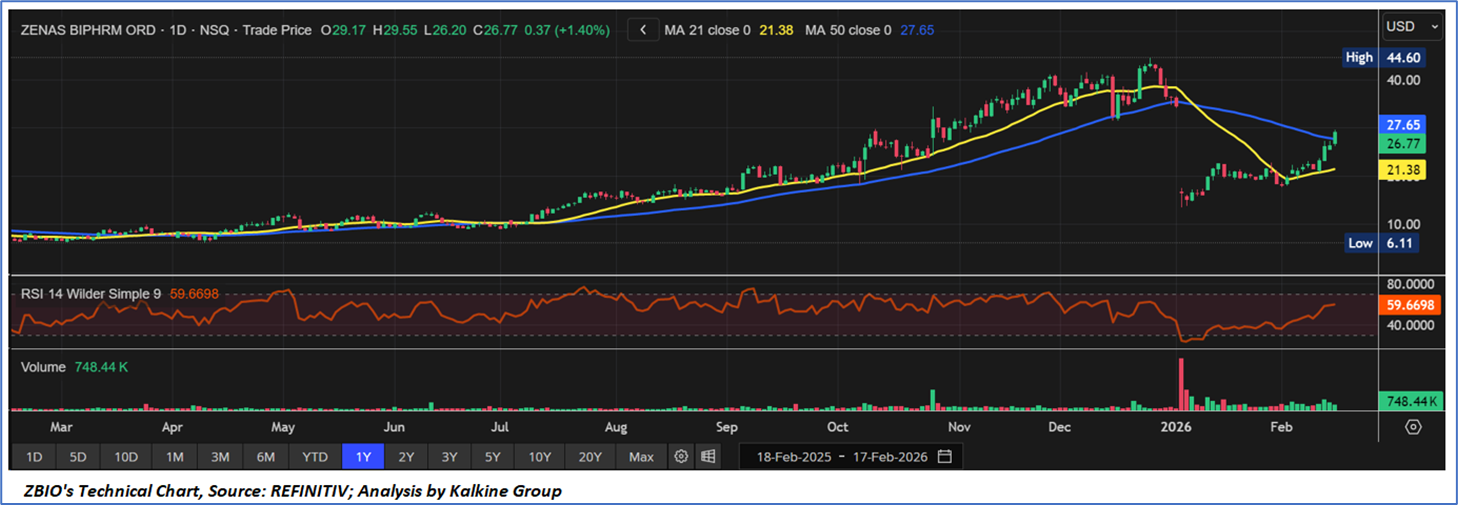
Zenas BioPharma Inc. remains a clinical-stage biopharmaceutical company focused on advancing obexelimab for autoimmune diseases, operating without commercial product revenue and reporting Q3 FY25 revenue of USD 0.6 million, consistent year-over-year. R&D expenditure increased to USD 22.4 million, contributing to an operating loss of USD 28.7 million and a net loss of USD 28.5 million (USD 0.47 per share), reflecting continued capital deployment toward Phase 2/3 clinical development and manufacturing scale-up. The company ended the quarter with USD 112.3 million in cash, supporting ongoing trial execution, although sustained cash burn underscores reliance on external funding prior to commercialization. Key risks remain centered on clinical trial outcomes, regulatory approvals, competitive positioning within immunology, and potential future dilution. From a technical standpoint, the stock is stabilizing near USD 26.77, having reclaimed its 21-day moving average but facing resistance at the 50-day moving average around USD 27.65, with RSI near 59.7 indicating improving momentum yet remaining below overbought levels; confirmation of a broader trend recovery would require sustained strength above intermediate resistance.
As per the above-mentioned price action, important support near USD 22.00- USD 24.00, momentum in the stock over the last month, and technical indicators analysis, a ‘WATCH’ rating has been given for Zenas BioPharma, Inc. (NASDAQ: ZBIO), at the closing price of USD26.77, as of February 17, 2026.
Individuals can evaluate the stock based on the support and resistance levels provided in the report in case of keen interest taking into consideration the risk-reward scenario.
Markets are trading in a highly volatile zone currently due to certain macro-economic issues and prevailing geopolitical tensions. Therefore, it is prudent to follow a cautious approach while investing.
Related Risk: This report may be looked at from a high-risk perspective, and a recommendation is provided for a short duration. This report is solely based on technical parameters, and the fundamental performance of the stocks has not been considered in the decision-making process. Other factors which could impact the stock prices include market risks, regulatory risks, interest rates risks, currency risks, social and political instability risks etc.
Note 1: Past performance is not a reliable indicator of future performance.
Note 2: The reference date for all price data, currency, technical indicators, support, and resistance level is February 17, 2026. The reference data in this report has been partly sourced from REFINITIV.
Note 3: Investment decisions should be made depending on an individual's appetite for upside potential, risks, holding duration, and any previous holdings. An 'Exit' from the stock can be considered if the Target Price mentioned as per the Valuation and or the technical levels provided has been achieved and is subject to the factors discussed above.
Note 4: Target Price refers to a price level that the stock is expected to reach as per the relative valuation method and or technical analysis taking into consideration both short-term and long-term scenarios.
Note 5: ‘Kalkine reports are prepared based on the stock prices captured either from the New York Stock Exchange (NYSE), NASDAQ Capital Markets (NASDAQ), and or REFINITIV. Typically, all sources (NYSE, NASDAQ, or REFINITIV) may reflect stock prices with a delay which could be a lag of 15-20 minutes. There can be no assurance that future results or events will be consistent with the information provided in the report. The information is subject to change without any prior notice.

 CA
 NZ
 UK
 US
 IND

 AU

 Please wait processing your request...