Vita Group Ltd
.JPG)
VTG Details
Expects to deliver improved productivity from retail network: During H1FY17, Vita Group Ltd reported strong performance by posting 8% revenue growth from continuing operations to $344.1mn while EBITDA (earnings before interest, tax, depreciation and amortization) witnessed 4% growth at $35.0mn. The revenue growth was driven by execution of strategy to optimize its retail channel and scaling up its business channels. The group continues to focus on improving the productivity of its existing store portfolio and reducing performance variability, whilst at the same time lifting average store earnings through targeted additions to the store network. While Vita benefited from the acquisition of three Telstra stores, it has closed one store during the same period. The company expects to deliver improved productivity from its retail network stores while targeting on increasing momentum in the performance of its business channels. Additionally, in the short term, Vita will further increase its retail presence with the acquisition of five Telstra stores, which will take its Telstra licensed store portfolio to 107. Further optimization of the portfolio is expected with acquisitions, divestments and closures.
.png)
Results summary (Source: Company Reports)
With no net debt on the balance sheet, growth in earnings and strong cash generation will enable the group to continue to invest in its growing businesses and reward shareholders with higher dividends. The Board declared a fully franked record dividend of 9.20cps (up 60% year on year). The stock has corrected 46% over the past six months (as at April 10, 2017), and may face headwinds owing to current competitive environment and speculations relating to Telstra taking back stores from licensees (including Vita).Hence, we give a “Hold” on the stock at the current market price of $ 2.59
.png)
VTG Daily Chart (Source: Thomson Reuters)
Quintis Ltd
.JPG)
QIN Details
Expanding into new geographies but market volatility prevails: During H1FY17, Quintis Ltd reported 92x of sales on H1 FY16 led by 32% increase in plantation sales and significant ramp-up in exports of processed Indian sandalwood oil. However, sales in H1FY17 were a tad behind street estimates due to supply chain issues with first time wood exports to China and the Middle East. Further, normalized profit after tax (NPAT) declined due to a lower FX gain and one-off cost of $10.6mn for the refinance of senior secured notes.

Pipeline of commercial developments in 2017 (Source: Company Reports)
Recently, the company entered into a five-year agreement to supply premium Indian sandalwood oil to US-based Young Living (the largest essential oil company) in the world. Further, robust product sales of $45mn- $55mn has been expected in FY17 (up from $30mn in FY16) on account of first-time deliveries to India and the Middle East. Management also guided for 25% increase in EBITDA and strong cash flows during FY17. The stock was declined 13.4% in the past one month (as at April 10, 2017), with the resignation of the managing director and speculations around a change of control transaction. The group also tried to respond to ASX Query to substantiate its allegations against the short-seller Glaucus Research that claimed QIN business to be a Ponzi-like business, which is set to fail. Quintis has also recently revealed that orders from a major Chinese customer, Shanghai Richer Link, have not fallen in place like last year owing to a probe into customs avoidance. Owing to the recent pressure, Quintis has tapped deputy chairman Julius Matthys as its interim chief executive. Given the prevailing volatility, we put a “Hold” on the stock at the current market price of $ 1.25
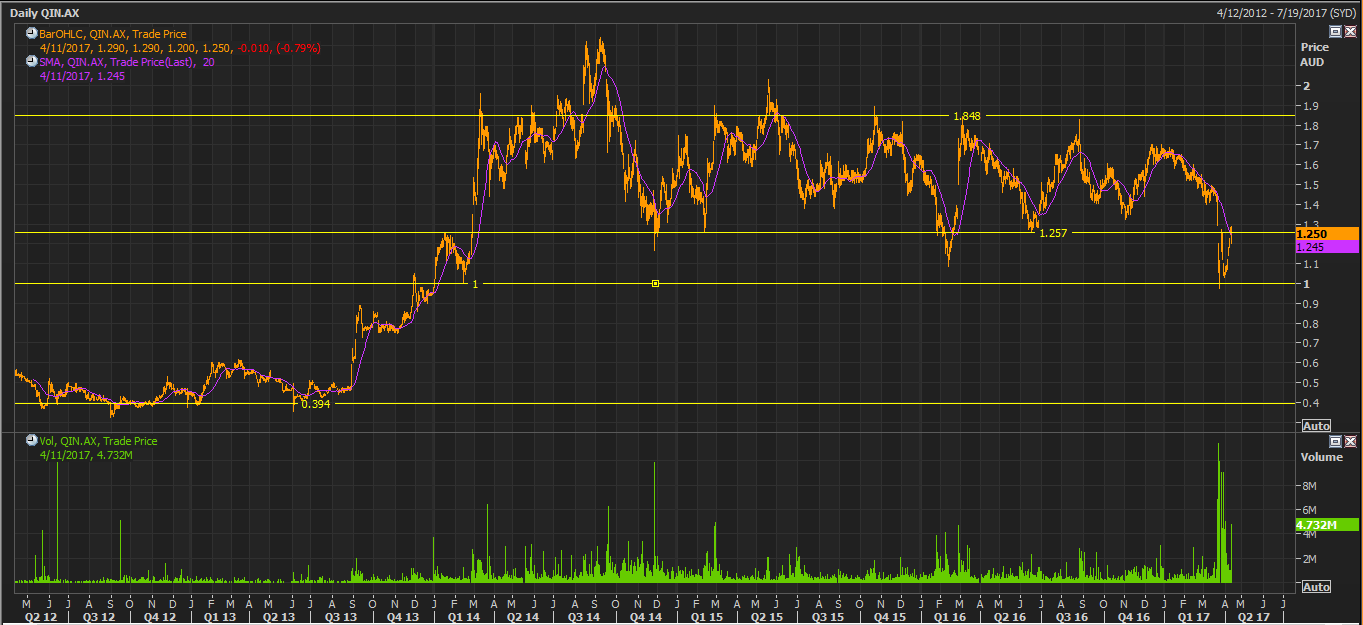
QIN Daily Chart (Source: Thomson Reuters)
WAM Capital Ltd

WAM Details
Sufficient profit reserves and franking credits: For H1FY17, WAM Capital Ltd had reported an operating profit before tax of $79.7mn (2015: $103.0 million) and operating profit after tax of $59.1mn (2015: $74.6 million). The decline in operating profit was due to the change in value of the investment portfolio between the respective periods. The investment portfolio increased 9.7% while it increased 16.5% during corresponding period of FY16; and rose 14.5% in the 12 months to 31 December 2016, outperforming the market by 2.9%. The post-tax Net Tangible Assets, including the 7.25 cent fully franked final dividend, increased by 8.8% from $1.86 per share to $1.95 per share, after tax paid during the period. WAM Capital continues to grow its asset base and shareholders’ equity by more than 30% to $1.2bn.
.png)
Performance (Source: Company Reports)
The Board is committed to paying an increasing stream of fully franked dividends to shareholders, given the company has sufficient profit reserves and franking credits. The company announced a fully franked interim dividend of 7.5c per share in FY17 against 7.25c in FY16. Further, the dividend reinvestment plan (DRP) is available to shareholders for the interim dividend and the plan has been said to operate at a 2.5% discount. However, factors such as the discretionary retail sector underperforming owing to fears of entry from Amazon in Australia and measures taken by Australian Prudential Regulation Authority on mortgage lending, have impacted the equity markets to some extent; and this has partly impacted the WAM portfolio performance in last six months against the S&P/ASX All Ordinaries Accumulation Index. WAM stock is also trading at a price nearing full value (as at April 11, 2017).Given the trading scenario and some recent headwinds, we give a “Hold” on the stock at the current market price of $ 2.55
.png)
WAM Daily Chart (Source: Thomson Reuters)
Challenger Ltd
.JPG)
CGF Details
Footprint expansion and decent cash operating earnings guidance for FY17: Challenger Ltd recently raised $460 million through issuance of 4.6 mn notes for $100 each and has closed its Capital Notes 2 offer. During H1FY17, CGF reported a normalised net profit after tax (NPAT) at $196.6mn (8% growth). Total Group assets under management (AUM) grew by 12% yoy to $64.7bn during the same period. However, statutory NPAT declined by 14% to $202mn (against 1H16 figure of $234 million) largely due to a significant one-off item. Further, during H1FY17, cost to income ratio improved by 90 basis points (bps) to a record low of 32.9%. Normalised pre-tax return on equity (ROE) increased by 60 bps to 18.7%, while normalised earnings per share rose 7% to 35.0 cents per share (cps). Company is expected to report cash operating earnings of $620mn-$640mn in FY17 and overall normalized pre-tax ROE of 18% while maintaining a 45-50% fully franked dividend payout. CGF recently formed an annuities distribution relationship with MS Primary (a leading provider of Australian dollar annuities and life insurance products in Japan) and launched a new Australian dollar annuity product in Japan. The market in Japan for Australian dollar annuities is estimated to be 7x the size of the Australian market driven by ageing population coupled with low domestic interest rates. This partnership has already delivered sales of $125 million for Challenger during the initial two-month period till 31 December 2016. Further, it expands Challenger’s product and distribution footprint in Japan in an efficient manner with no fixed direct distribution costs. Challenger’ capital position seems to be sufficient to support future growth with $0.9bn of excess regulatory capital and group cash. This represents 1.4x of required regulatory capital set by the APRA (Australian Prudential Regulatory Authority) and within its target range of 1.3x to 1.6x. Further, it is anticipated that this will increase to 1.5x as the company intends to issue new additional tier-1 capital notes in Q317 by raising $350mn. Over the past six months, the stock has moved up by 20% on value buying and recent business expansion into Japan (as at April 10, 2017) and now trades close to its 52-week high price. We give a “Hold” recommendation at the current market price of $ 12.78
.png)
CGF Daily Chart (Source: Thomson Reuters)
Magellan Financial Group Ltd
.JPG)
MFG Details
Rise in Funds under Management:As at March 31, 2017, Magellan Financial Group Ltd reported that the total Funds under Management (FUM) have risen to $47.7bn against $46.7bn as at February 28, 2017. During H1FY17, the company reported a revenue decline of 16% year on year while posting 20% de-growth in after-tax profit at $87.0mn. Management and services fees increased 10% in line with the increase in average funds under management while performance fees were materially lower resulting in a corresponding decrease in earnings and dividend. However, excluding performance fees, underlying profitability increased by 9% during the same period.
.png)
Dividend payment history (Source: Company Reports)
The company has a continued policy of paying a dividend of 75%-80% of the net profit after tax (NPAT) of the Group’s funds management business. Given the prospects, we maintain a “Buy” on the stock at the current market price of $ 24.00
.png)
MFG Daily Chart (Source: Thomson Reuters)
Disclaimer
The advice given by Kalkine Pty Ltd and provided on this website is general information only and it does not take into account your investment objectives, financial situation or needs. You should therefore consider whether the advice is appropriate to your investment objectives, financial situation and needs before acting upon it. You should seek advice from a financial adviser, stockbroker or other professional (including taxation and legal advice) as necessary before acting on any advice. Not all investments are appropriate for all people. Kalkine.com.au and associated pages are published by Kalkine Pty Ltd ABN 34 154 808 312 (Australian Financial Services License Number 425376). The information on this website has been prepared from a wide variety of sources, which Kalkine Pty Ltd, to the best of its knowledge and belief, considers accurate. You should make your own enquiries about any investments and we strongly suggest you seek advice before acting upon any recommendation. Kalkine Pty Ltd has made every effort to ensure the reliability of information contained in its newsletters and websites. All information represents our views at the date of publication and may change without notice. To the extent permitted by law, Kalkine Pty Ltd excludes all liability for any loss or damage arising from the use of this website and any information published (including any indirect or consequential loss, any data loss or data corruption). If the law prohibits this exclusion, Kalkine Pty Ltd hereby limits its liability, to the extent permitted by law to the resupply of services. There may be a product disclosure statement or other offer document for the securities and financial products we write about in Kalkine Reports. You should obtain a copy of the product disclosure statement or offer document before making any decision about whether to acquire the security or product. The link to our Terms & Conditions has been provided please go through them and also have a read of the Financial Services Guide. On the date of publishing this report (mentioned on the website), employees and/or associates of Kalkine Pty Ltd currently hold positions in: BHP, BKY, KCN, PDN, and RIO. These stocks can change any time and readers of the reports should not consider these stocks as advice or recommendations.
 AU
AU

 Please wait processing your request...