ASML Holding NV
ASML Holding N.V. (NASDAQ: ASML) is a holding company based in the Netherlands. The Company operates through its subsidiaries in the Netherlands, the United States, Italy, France, Germany, the United Kingdom, Ireland, Belgium, South Korea, Taiwan, Singapore, China, Hong Kong, Japan, Malaysia and Israel. The Company operates through one business segment which is engage in development, production, marketing, sales, upgrading and servicing of advanced semiconductor equipment systems, consisting of lithography, metrology and inspection systems.

Key Business and Financial Updates:
- Quarterly Performance: Mixed Earnings with Revenue Strength: ASML reported a mixed Q4 2025 performance, with earnings per share of EUR 7.35, slightly below expectations (−3.03% miss), while revenue came in at EUR 9.72 billion, marginally exceeding forecasts. Despite the earnings miss, market sentiment remained constructive, as reflected in a ~0.7% premarket stock increase, indicating investor confidence in the company’s structural growth drivers.
- Full-Year Financial Performance and Profitability: For FY2025, ASML delivered robust financial results, with EUR 32.7 billion in revenue, EUR 9.6 billion in net income, and a 52.8% gross margin, translating to EPS of approximately EUR 25. The performance was primarily driven by strong demand for advanced lithography systems, with EUV and immersion technologies contributing ~90% of system revenue, reinforcing ASML’s dominant market position.
- Technology Leadership and Growth Drivers: The company’s growth continues to be underpinned by its technological leadership in EUV lithography, with the EUV segment expanding 39% YoY. Additionally, the installed base business grew 26%, reflecting strong service and upgrade demand. The accelerating adoption of AI-driven semiconductor applications is significantly increasing demand for advanced chips, thereby driving higher lithography intensity and sustained demand across ASML’s product portfolio, including both EUV and DUV systems.
- Outlook and Long-Term Growth Visibility: ASML provided a constructive outlook, guiding 2026 revenue to EUR 34–39 billion with gross margins of 51%–53%, implying continued double-digit growth. Over the longer term, the company projects EUR 44–60 billion revenue by 2030, supported by structural demand from AI, advanced logic, and memory. Increasing EUV adoption, High-NA technology rollout, and capacity expansion by semiconductor manufacturers are expected to remain key growth catalysts.
- Risks, Strategic Adjustments, and Industry Dynamics: Despite strong fundamentals, ASML faces notable risks, including a declining contribution from China (expected ~20% of sales), potential supply chain disruptions, and execution risks related to organizational restructuring. Additionally, macroeconomic uncertainty and competitive pressures in semiconductor equipment could impact demand cycles. However, management is proactively enhancing agility, investing in innovation, and optimizing engineering capabilities to sustain long-term competitiveness.
Key Company specific risks for ASML:
- Cyclical Semiconductor Demand and Customer CapEx Risk: ASML’s revenue is highly dependent on capital expenditure cycles of semiconductor manufacturers (e.g., foundries and memory players). Any slowdown in global semiconductor demand—driven by macroeconomic weakness, inventory corrections, or delayed fab expansions—can lead to order volatility, shipment delays, and revenue cyclicality, particularly given the high-ticket nature of EUV systems.
- Geopolitical and China Exposure Risk: ASML faces significant geopolitical risk, particularly related to export restrictions on advanced lithography systems to China. With China historically contributing a meaningful share of sales (declining toward ~20%), tightening regulations or further trade restrictions could impact revenue mix, limit market access, and create demand uncertainty across both EUV and DUV segments.
- Execution and Technology Transition Risk (EUV & High-NA): The company’s growth outlook is closely tied to the successful scaling and adoption of next-generation technologies, including High-NA EUV systems. Delays in customer adoption, technical challenges, yield issues, or slower-than-expected ramp-ups could impact order flow and margins. Additionally, ASML’s increasing organizational complexity and restructuring efforts introduce execution risk in maintaining innovation velocity and operational efficiency.
Technical Observation (on the daily chart):
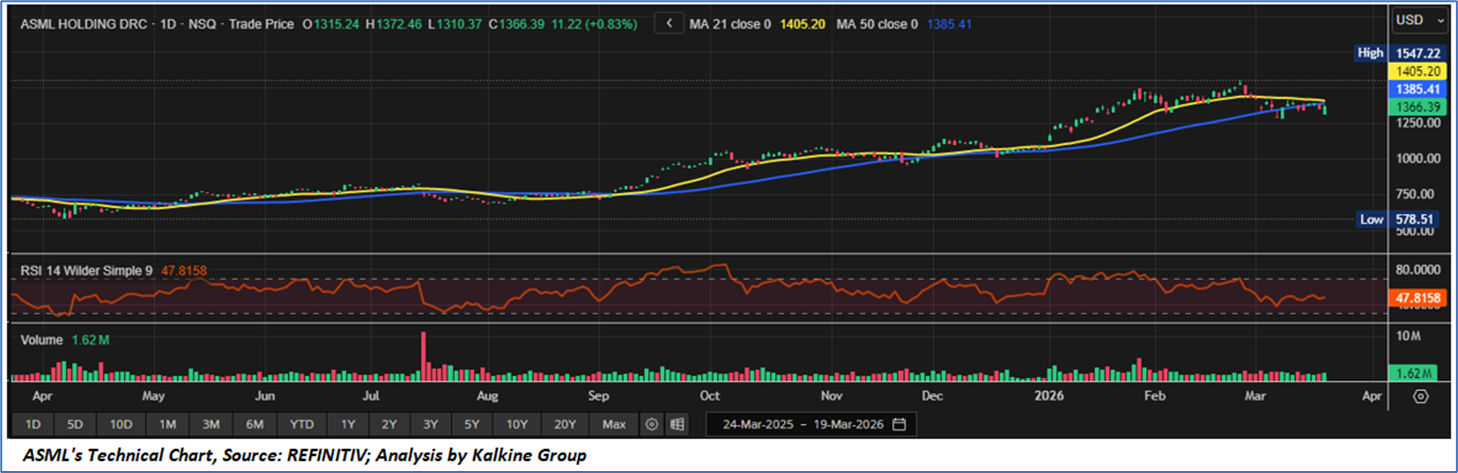
- Price Trend and Moving Average Positioning: ASML Holding (ASML) continues to exhibit a structurally bullish long-term trend, although recent price action indicates a phase of short-term consolidation following its rally toward USD 1,547 highs. The stock is currently trading around USD 1,366, slightly below the 21-day moving average (USD 1,405) and near the 50-day moving average (USD 1,385). This positioning suggests a loss of short-term momentum, with price compressing between key moving averages. However, the broader trend remains intact as the stock continues to hold above longer-term support levels.
- Momentum Indicators and Trend Strength: Momentum indicators reflect a neutral-to-moderate momentum environment, with the Relative Strength Index (RSI) around 47, indicating neither overbought nor oversold conditions. This suggests the stock is currently in a consolidation or base-building phase rather than a strong directional trend. The flattening RSI also implies that buying momentum has cooled following the prior uptrend, but there is no significant bearish divergence, indicating stability rather than a sharp trend reversal.
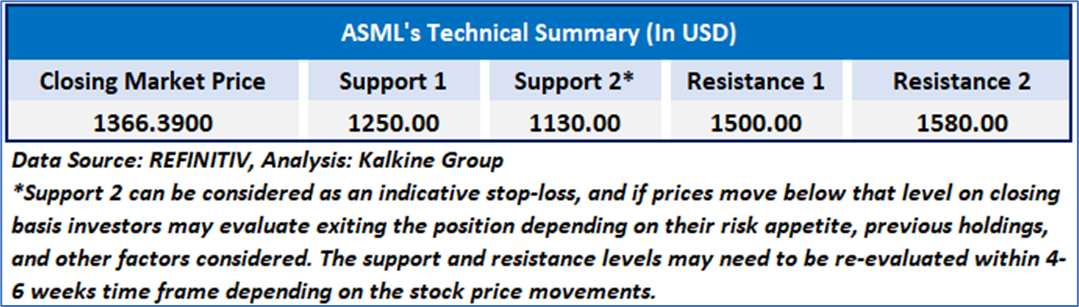
- Support, Resistance, and Volume Structure: From a key levels perspective, immediate support is observed near the USD 1,350–USD 1,380 range, aligned with the 50-day moving average, while stronger support lies around the USD 1,250 zone. On the upside, resistance is seen near the USD 1,400–USD 1,405 level (21DMA), followed by the recent highs around USD 1,540–USD 1,550. Volume trends appear relatively stable without aggressive selling, indicating controlled consolidation rather than distribution. Overall, the technical setup suggests a pause within a broader uptrend, with a potential breakout contingent on reclaiming short-term moving averages.
ASML Holding N.V. presents a balanced fundamental and technical profile, characterized by strong long-term growth drivers alongside near-term execution and macro risks. The company delivered solid FY2025 financial performance with EUR 32.7 billion revenue, EUR 9.6 billion net income, and 52.8% margins, supported by continued leadership in EUV lithography and rising demand from AI-driven semiconductor applications. While Q4 results showed a minor earnings miss, revenue resilience and positive market reaction indicate sustained investor confidence. Looking ahead, ASML’s guidance reflects continued growth supported by EUV adoption, High-NA innovation, and global capacity expansion, although exposure to semiconductor cycles, geopolitical constraints (particularly China), and execution risks around next-generation technologies remain key considerations. Technically, the stock is currently in a consolidation phase within a broader uptrend, suggesting stability with potential upside contingent on reclaiming near-term resistance levels.
As per the above-mentioned price action, important resistance near USD1400- USD 1450, momentum in the stock over the last month, and technical indicators analysis, a ‘WATCH’ rating has been given for ASML Holding N.V. (NASDAQ: ASML), at the closing price of USD 1366.39, as of March 19, 2026.
Individuals can evaluate the stock based on the support and resistance levels provided in the report in case of keen interest taking into consideration the risk-reward scenario.
Markets are trading in a highly volatile zone currently due to certain macro-economic issues and prevailing geopolitical tensions. Therefore, it is prudent to follow a cautious approach while investing.
Related Risk: This report may be looked at from a high-risk perspective, and a recommendation is provided for a short duration. This report is solely based on technical parameters, and the fundamental performance of the stocks has not been considered in the decision-making process. Other factors which could impact the stock prices include market risks, regulatory risks, interest rates risks, currency risks, social and political instability risks etc.
Note 1: Past performance is not a reliable indicator of future performance.
Note 2: The reference date for all price data, currency, technical indicators, support, and resistance level is March 19, 2026. The reference data in this report has been partly sourced from REFINITIV.
Note 3: Investment decisions should be made depending on an individual's appetite for upside potential, risks, holding duration, and any previous holdings. An 'Exit' from the stock can be considered if the Target Price mentioned as per the Valuation and or the technical levels provided has been achieved and is subject to the factors discussed above.
Note 4: Target Price refers to a price level that the stock is expected to reach as per the relative valuation method and or technical analysis taking into consideration both short-term and long-term scenarios.
Note 5: ‘Kalkine reports are prepared based on the stock prices captured either from the New York Stock Exchange (NYSE), NASDAQ Capital Markets (NASDAQ), and or REFINITIV. Typically, all sources (NYSE, NASDAQ, or REFINITIV) may reflect stock prices with a delay which could be a lag of 15-20 minutes. There can be no assurance that future results or events will be consistent with the information provided in the report. The information is subject to change without any prior notice.

 CA
 NZ
 UK
 US
 IND

 AU

 Please wait processing your request...