ConocoPhillips
.png)
COP Details
Reported 5% Growth in Production: ConocoPhillips (NYSE: COP) is a diversified oil exploration company with resource-rich conventional and unconventional assets located across North America, Europe, Asia and Australia.
FY19 Operational Highlights for the Period ended 31 December 2019: COP reported its FY19 total revenues and other income of $36,670 million, down from $38,727 million in FY18. The company reported full year production of 1,305 MBOED, up 5%, excluding its Libya Operations. Net income stood at $7,257 million, that increased from $6,305 million reported in the previous financial year. During the period, the business witnessed increased in production from its Lower 48 Big 3 unconventionals by 22% on y-o-y basis.
.png)
Key Income Statement Highlights for FY19 (Source: Company Reports)
Outlook: For FY20, the business is likely to allocate $6.5 billion to $6.7 billion for capital expenditure while, production is expected within the range of 1,230 MBOED to 1,270 MBOED. The company estimated its FY20 operating costs at ~$5.9 billion.
Valuation Methodology: Price to Earnings Based Relative Valuation
.png)
Price to Earnings Based Relative Valuation (Source: Thomson Reuters)
Note: All the forecasted figures are taken from Thomson Reuters, NTM: Next Twelve Months
Stock Recommendation:The stock of COP closed at $49.43 with a market capitalization of ~$53.44 billion. The stock made a 52-week low and high of $45.12 and $70.06 and is currently trading at the lower band of its 52-week trading range. The stock has corrected by ~13.4% and ~28.37% in the last nine months and one year, respectively. Going forward, the company is expected to deliver sustained value through price cycles through its strong balance sheet, and will focus on free cash flow generation, compelling returns of and returns on capital followed by its commitment to environmental, social and governance leadership. Considering the aforesaid facts, current trading levels, business prospects, etc., we have valued the stock using Price to Earnings based relative valuation method. For this, we have considered peers like Apache Corp (NYSE: APA), Marathon Oil Corp (NYSE: MRO), Devon Energy Corp (NYSE: DVN), etc., and arrived at a target price which is offering a lower double-digit upside (in % terms). Hence, we give a ‘Buy’ recommendation on the stock at the closing price of $49.43, up 2.72% as on 4th March 2020.
WEX Inc.
.png)
WEX Details
Higher Global Demand to Drive Business Growth: WEX Inc. (NYSE: WEX) provides innovative services likecorporate purchasing and payment capabilities for its clients.
FY19 Operational Highlights for the Period ended 31 December 2019: WEX reported its full year revenue of ~$1,724 million, up 15.5% on y-o-y basis aided by growth across all the three segments. The business reported a robust growth of 19% in the average number of vehicles to ~14.0 million in FY19, driven by growth in worldwide customer base. The health and employee benefit solution segment reported a solid growth of 69.1% on y-o-y basis in the fourth quarter, while travel and corporate solution segment reported a growth of 22.7% on y-o-y basis in the same time span.
.png)
Key Highlights (Source: Company Reports)
Valuation Methodology: Price to Earnings Based Relative Valuation
.png)
Price to Earnings Based Relative valuation (Source: Thomson Reuters)
Note: All the forecasted figures are taken from Thomson Reuters, NTM: Next Twelve Months
Guidance: For FY20, the company expects its revenue within the range of $1,860 million to $1,900 million, depicting a growth of 7% to 9%.Adjusted net income is anticipated in the band of $447 million to $464 million in FY20.
Stock Recommendation:The stock of WEX closed at $182.74 with a market capitalization of ~$7.92 billion. The stock is currently trading at the lower band of its 52-week trading low and high range of $170.27 and $236.52, respectively. The stock has corrected by ~7.52% and ~9.8% in the last three months and six-months, respectively. Going forward, the company remains on track to invest in new and innovative technology, which is likely to enhance its competitive position within the segment. Considering the aforesaid facts, current trading levels and business prospects, we have valued the stock using Price to Earnings based relative valuation method. For this purpose, we have considered peers like Visa Inc (NYSE: V), American Express Co (NYSE: AXP), Fleetcor Technologies Inc (NYSE: FLT), etc., and arrived at a target price with a lower double-digit upside (in % terms). Hence, we give a ‘Buy’ recommendation on the stock at the closing price of $182.74, up 0.13% as on 4th March 2020.
Exxon Mobil Corp
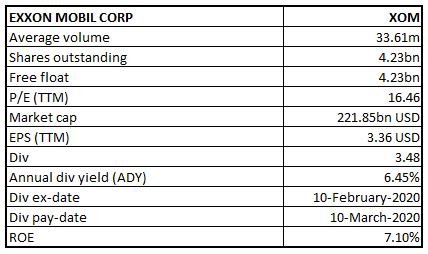
XOM Details
Cost Control techniques and Higher Productivity to Aid Business Growth: Exxon Mobil Corporation (NYSE: XOM) operates in the energy segment and uses technology and innovation to cater the need of its clients.
FY19 Operational Highlights for the Period ended 31 December 2019: XOM declared its full year results, wherein the company reported revenue of $264,938 million, as compared to $290,212 million in FY18. The company reported its upstream earnings of $14,442 million, up $363 million from FY18. The quarter was marked by favorable volume and mix effects, which led to earnings growth. The business reported liquids production of 2.4 million barrels per day, depicting a rise of 120,000 barrels per day reflecting growth and higher entitlements. Within the Downstream segment, earnings were reported at $2,323 million, as compared to $6,010 million in FY18, due to the impact of lower North American crude differentials. Net income of the company stood at $14,340 million, down from $20,840 million in FY18.
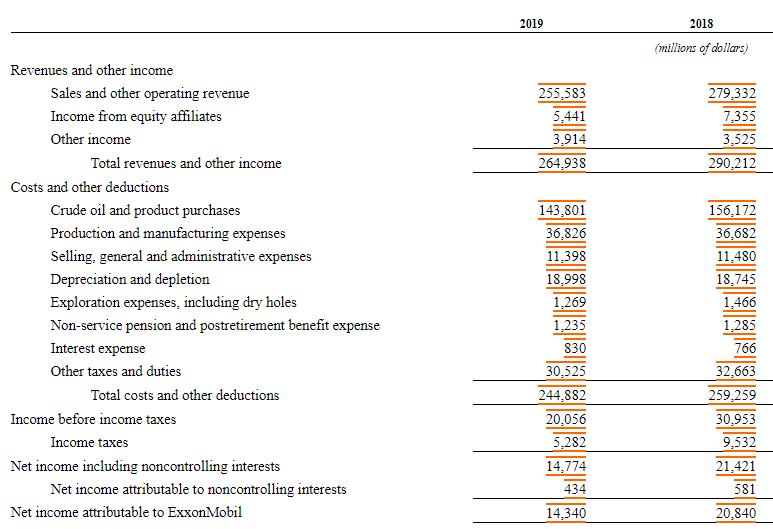
FY19 Income Statement Highlights (Source: Company Reports)
Valuation Methodology: EV/Sales Based Valuation
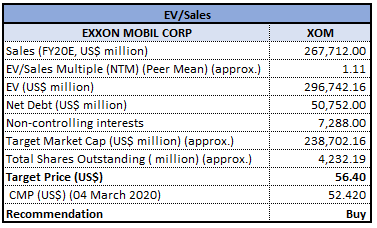
EV/Sales Based Valuation (Source: Thomson Reuters)
Note: All the forecasted figures are taken from Thomson Reuters, NTM: Next Twelve Months
Stock Recommendation:The stock of XOM closed at $52.42 with a market capitalization of ~$221.85 billion. The stock made a 52-week low and high of $48.01 and $83.49 and is currently trading at the lower band of the range. The stock has corrected by ~23.64% and ~24.34% in the last three months and six-months, respectively.The Management is continuously focusing on technology improvements, cost control, productivity enhancements, regular reappraisal of its asset portfolio, while it is also prioritizing on the recruitment, development, and retention of high caliber employees. Considering the aforesaid facts, current trading levels and business prospects, we have valued the stock using Enterprise Value to Sales based relative valuation method. For this purpose, we have considered peers like Chevron Corp (NYSE: CVX), ConocoPhillips (NYSE: COP), BP PLC (NYSE: BP), etc., and arrived at a target price with a higher single-digit upside (in % terms). Hence, we give a ‘Buy’ recommendation on the stock at the closing price of $52.42, up 2.18% as on 4th March 2020.
Dell Technologies Inc.
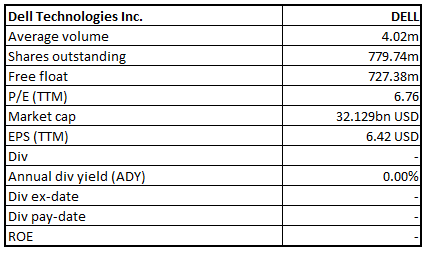
DELL Details
Higher Demand for Commercial Desktops and Workstations aid Business Growth: Dell Technologies Inc. (NYSE: DELL) is an information technology company, which provides innovative technologies to corporates.
FY20 Operating Highlights for the Period ended 31 January 2020: DELL declared its full-year results, wherein the company reported total net revenue of $92,154 million, up 2% on y-o-y basis, aided by double-digit unit and revenue growth in commercial desktops and workstations. During CY19, the business reported a record shipment of 46.5 million units. Within the Infrastructure Solutions Group, the company advanced to a subscription-based model which enables customers to accelerate hybrid cloud deployments and simplify IT operations. Research and development expenses stood at $4,992 million, up 8% on y-o-y basis. The company turned to profitability with net income of $5,529 million, as compared to a loss of $2,181 million in FY19.
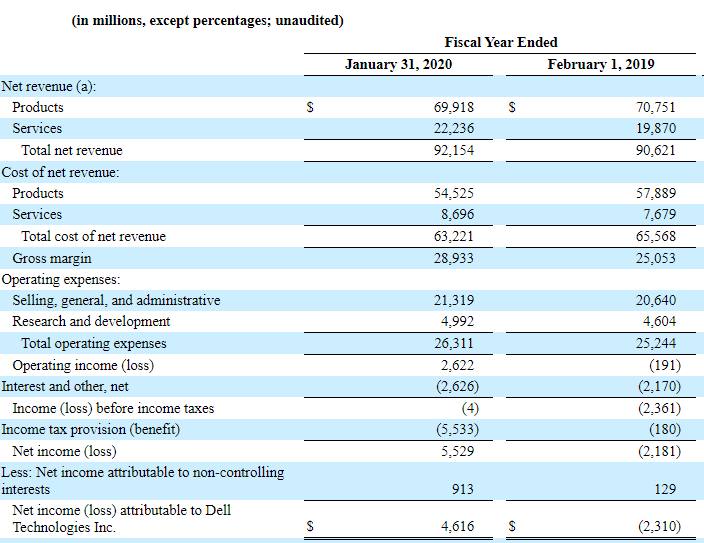
Key FY19 Income Statement Highlights (Source: Company Reports)
Valuation Methodology: Price to Earnings Based Relative Valuation
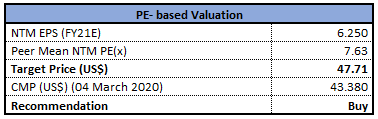
Price to Earnings based relative valuation (Source: Thomson Reuters)
Note: All the forecasted figures are taken from Thomson Reuters, NTM: Next Twelve Months
Stock Recommendation:The stock of DELL closed at $43.38 with a market capitalization of ~$32.129 billion. The stock made a 52-week low and high of $39.20 and $70.55 and is currently trading at the lower band of its 52-week trading range. The stock has corrected by ~9.01% and ~15.27% in the last three months and six-months, respectively.Going forward, the company will be focusing on integration and simplicity within the businesses and upgrading its product portfolio to accelerate winning go-to-market solutions for its clients. Considering the aforesaid facts, current trading levels and business prospects, we have valued the stock using Price to Earnings based relative valuation method. For this purpose, we have considered peers like Hewlett Packard Enterprise Co (NYSE: HPE), HP Inc (NYSE: HPQ) and International Business Machines Corp (NYSE: IBM). We have arrived at a target price with a lower-double upside (in % terms). Hence, we give a ‘Buy’ recommendation on the stock at the closing price of $43.38, up 3.83% as on 4th March 2020.
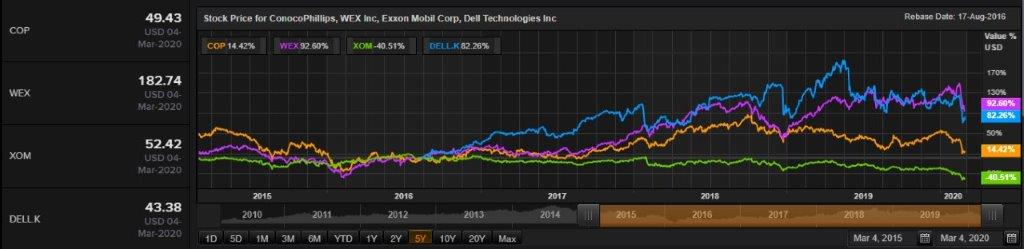
Comparative Price Chart (Source: Thomson Reuters)
Disclaimer
The advice given by Kalkine Pty Ltd and provided on this website is general information only and it does not take into account your investment objectives, financial situation or needs. You should therefore consider whether the advice is appropriate to your investment objectives, financial situation and needs before acting upon it. You should seek advice from a financial adviser, stockbroker or other professional (including taxation and legal advice) as necessary before acting on any advice. Not all investments are appropriate for all people. Kalkine.com.au and associated pages are published by Kalkine Pty Ltd ABN 34 154 808 312 (Australian Financial Services License Number 425376). The information on this website has been prepared from a wide variety of sources, which Kalkine Pty Ltd, to the best of its knowledge and belief, considers accurate. You should make your own enquiries about any investments and we strongly suggest you seek advice before acting upon any recommendation. Kalkine Pty Ltd has made every effort to ensure the reliability of information contained in its newsletters and websites. All information represents our views at the date of publication and may change without notice. To the extent permitted by law, Kalkine Pty Ltd excludes all liability for any loss or damage arising from the use of this website and any information published (including any indirect or consequential loss, any data loss or data corruption). If the law prohibits this exclusion, Kalkine Pty Ltd hereby limits its liability, to the extent permitted by law to the resupply of services. There may be a product disclosure statement or other offer document for the securities and financial products we write about in Kalkine Reports. You should obtain a copy of the product disclosure statement or offer document before making any decision about whether to acquire the security or product. The link to our Terms & Conditions has been provided please go through them and also have a read of the Financial Services Guide. On the date of publishing this report (mentioned on the website), employees and/or associates of Kalkine Pty Ltd do not hold positions in any of the stocks covered on the website. These stocks can change any time and readers of the reports should not consider these stocks as advice or recommendations.
 AU
AU

 Please wait processing your request...