.png)
Stocks’ Details
Orocobre Limited
Operational Update for December 2019 Quarter: Orocobre Limited (ASX: ORE) is engaged in the exploration and production of mineral with an increased focus on developing Lithium resources in Argentina. The company recently reported production of 3,586 tonnes for December 2019 quarter, depicting a decline of ~5% on a year over year basis.
In addition, product sales volume stood at 3,287 tonnes of lithium carbonate at an average price amounting to US$5,419/tonne on an FOB basis, and total sales revenue stood at US$17.8 million.Cost of sale stood at US$4,109/tonne during the December quarter.
.png)
Operational Highlights (Source: Company Reports)
What to Expect: For FY20, the company predicts full-year production to be at least 5% higher as compared to the production of FY19. The company continues to focus on reducing the cost of production in order to sustain its position as one of the low-cost producers of lithium chemicals. Notably, the business is emphasizing on the current pricing to ensure the retention of market share.
Valuation Methodology: P/B Based Valuation
.png)
P/B Based Valuation (Source: Thomson Reuters)
Note: All forecasted figures have been taken from Thomson Reuters, NTM: Next Twelve Months
Stock Recommendation: The stock of ORE is trading at $3.640 with a market cap of ~$801.45 million. The stock is trending at the upper band of its 52-week trading range of $2.180 to $4.040. The stock has generated stellar returns of 11.27% and 15.04% in the last three months and six months, respectively. Considering the current price movement and trading levels, and encouraging business prospects, we have valued the stock using one relative valuation method, i.e., Price to Book Value multiple. We have considered peers like Galaxy Resources Ltd (ASX: GXT), Resolute Mining Ltd (ASX: RSG), Sandfire Resources NL (ASX: SFR), etc., and arrived at a target price of higher single-digit upside (in percentage terms). Hence, we recommend a ‘Hold’ rating on the stock at the current market price of $3.640, up 18.954% as on 5 February 2020.
Galaxy Resources Limited
Production Volume Towards the Upper End of Guidance Range: Galaxy Resources Limited (ASX: GXY) is involved in the production of lithium concentrate for minerals in Australia, Argentina and Canada. On 30 January 2020, the company announced that Credit Suisse Holdings (Australia) Limited on behalf of Credit Suisse Group AG and its affiliates, a substantial holder of the company, has increased its voting power from 5.11%.to 6.24%.
December Quarter 2019 Highlights:The company recently updated the market with the activities for December 2019 quarter. The company reported lithium concentrate production volume of 43,222 dry metric tonnes from Mt Cattlin, with grading 6.0% Li2O. This stood at the upper end of the production guidance range of 35,000 – 45,000 dmt. For the quarter, total sales volume stood at 29,778 dmt, which was just below the guidance range of 30,000 dmt – 45,000 dmt.
.png)
Production & Operation Highlights(Source: Company Reports)
Guidance: For Q1FY20, the company is anticipating lithium concentrate production volume in the range of 14,000 dmt – 20,000 dmt, subsequent to the restart of operations.
Valuation Methodology: P/B Based Valuation
.png)
P/B Based Valuation (Source: Thomson Reuters)
Note: All forecasted figures have been taken from Thomson Reuters, NTM: Next Twelve Months
Stock Recommendation: The stock of GXY is trading at $1.23 with a market cap of ~$427.91 million. The stock is trading below the average of its 52-week trading range of $0.815 to $2.300. The stock has generated a positive return of 6.63% in the past one month. Considering the current price movement and trading levels, we have valued the stock using one relative valuation method, i.e., Price to Book Value multiple. We have considered peers like Orocobre Ltd (ASX: ORE), Pilbara Minerals Ltd (ASX: PLS), Imdex Ltd (ASX: IMD), and arrived at a target price of lower double-digit upside (in percentage terms). Hence, we recommend a ‘Hold’ rating on the stock at the current market price of $1.23, up 17.703% as on 5 February 2020.
Pilbara Minerals Limited
A look at December 2019 Quarter: Pilbara Minerals Limited (ASX: PLS) is engaged in the exploration and development of lithium and tantalum. Production of spodumene concentrate at 5.91% Li2O was reported at 14,711 dry metric tonnes (dmt) during the December quarter 2019, as compared to 21,322 dmt in the previous quarter. The company shipped a total of 33,178 dmt of spodumene concentrate, during the quarter.
.png)
Spodumene concentrate Production (Source: Company Reports)
Cash Flow Details: Net cash outflow from operating activities for the period was reported at $14.307 million. Net cash outflow from investing activities for the period was reported at $6.947 million. Net cash inflow from financing activities for the period was reported at $65.655 million. Cash and cash equivalents at the end of the period were reported at $105.546 million.
What to Expect: The company anticipates cash operating costs in the range of US$320 - $350/dmt CFR China from June 2020.The company is confident about its outlook for the long and medium-term demand for its spodumene concentrate.
Valuation Methodology: P/B Based Valuation
.png)
P/B Based Valuation (Source: Thomson Reuters)
Note: All forecasted figures have been taken from Thomson Reuters, NTM: Next Twelve Months
Stock Recommendation: The stock of PLS is trading at $0.345 with a market cap of ~$689.35 million. The stock is trading below the average of its 52-week trading range of $0.250 to $0.885. Current ratio of the company stood at 2.13x in FY19 as compared to the industry median of 1.82x. This reflects that PLS is in a decent position to meet its short-term obligations as compared to the peer group. Considering the current price movement and trading levels, we have valued the stock using one relative valuation method, i.e., Price to Book Value multiple. We have considered peers like Western Areas Ltd (ASX: WSA), Galaxy Resources Ltd (ASX: GXY), Altura Mining Ltd (ASX: AJM), and arrived at a target price of lower double-digit upside (in percentage terms). Hence, we recommend a ‘Speculative Buy’ rating on the stock at the current market price of $0.345, up 11.29% as on 5 February 2020.
Neometals Limited
Leveraging Various Opportunities for Sustainable Future Growth: Neometals Limited (ASX: NMT) is engaged in developing its mineral projects and expanding its technology business unit.
Key Highlights of December’19 Quarter: The company stated that it has signed a MOU with worldwide recognised partners across battery recycling and titanium/vanadium projects.With respect to Lithium-ion Battery Recycling Project, the company signed a MOU with SMS Group, global processing plant manufacturer, to form an equal JV to commercialise Neometals’ recycling technology.
Cash Flow Highlights: Net cash outflow from operating activities for December quarter was reported at $3.912 million. Net cash outflow from investing activities for the period was reported at $2.501 million. Cash and cash equivalents at the end of the period stood at $100.698 million.
.png)
Cash Flow Details(Source: Company Reports)
Stock Recommendation: The stock of NMT is trading at $0.23 with a market cap of ~$100.74 million. The stock is trading close to its 52-week high of $0.244. Current ratio of the company stood at 34.17x in FY19 as compared to the industry median of 1.82x. Debt to equity ratio of the company stood at 0.00x in FY19 as compared to the industry median of 0.13x, which reflects a sound financial position. On the valuation front, the stock is trading at a price to book multiple of 0.7x as compared to the industry average of 1.5x on TTM (Trailing Twelve Months) basis. Hence, we recommend a ‘Hold’ rating on the stock at the current market price of $0.23, up 24.324% as on 5 February 2020.
The rise in the share prices can be attributed to the recent comments made by UK prime minister Boris Johnson, to prohibit the sale of new petrol and diesel cars from 2035. If the ban comes into existence, a lift in the demand for electric vehicles in the coming future can be expected. This, in turn, is likely to increase demand for battery materials such as lithium and graphite.
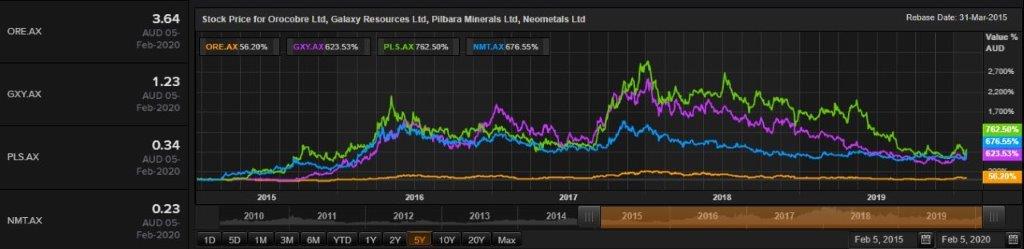
Comparative Price Chart (Source: Thomson Reuters)
Disclaimer
The advice given by Kalkine Pty Ltd and provided on this website is general information only and it does not take into account your investment objectives, financial situation or needs. You should therefore consider whether the advice is appropriate to your investment objectives, financial situation and needs before acting upon it. You should seek advice from a financial adviser, stockbroker or other professional (including taxation and legal advice) as necessary before acting on any advice. Not all investments are appropriate for all people. Kalkine.com.au and associated pages are published by Kalkine Pty Ltd ABN 34 154 808 312 (Australian Financial Services License Number 425376). The information on this website has been prepared from a wide variety of sources, which Kalkine Pty Ltd, to the best of its knowledge and belief, considers accurate. You should make your own enquiries about any investments and we strongly suggest you seek advice before acting upon any recommendation. Kalkine Pty Ltd has made every effort to ensure the reliability of information contained in its newsletters and websites. All information represents our views at the date of publication and may change without notice. To the extent permitted by law, Kalkine Pty Ltd excludes all liability for any loss or damage arising from the use of this website and any information published (including any indirect or consequential loss, any data loss or data corruption). If the law prohibits this exclusion, Kalkine Pty Ltd hereby limits its liability, to the extent permitted by law to the resupply of services. There may be a product disclosure statement or other offer document for the securities and financial products we write about in Kalkine Reports. You should obtain a copy of the product disclosure statement or offer document before making any decision about whether to acquire the security or product. The link to our Terms & Conditions has been provided please go through them and also have a read of the Financial Services Guide. On the date of publishing this report (mentioned on the website), employees and/or associates of Kalkine Pty Ltd do not hold positions in any of the stocks covered on the website. These stocks can change any time and readers of the reports should not consider these stocks as advice or recommendations.
 AU
AU

 Please wait processing your request...