Amcor Plc
.png)
AMC Details
Decent set of Numbers in 1H20 at a Decent Pace:Amcor Plc (ASX: AMC) is engaged in the development and production of rigid and flexible packaging for various food, beverage, pharmaceutical, medical-device, home and personal care and other fast-moving consumer end markets.
H1FY20 Business Highlights for the Period ended 31 December 2019: AMC declared its half-yearly results, wherein the company reported net sales H1FY20 on GAAP basis of US$6,184 million as compared to $4,546 million in 1HFY19. The company reported its net income at US$252 million, mildly improved from US$237 million in pcp.Within the Flexibles segment, the business reported a 1.4% y-o-y decline of income on constant currency terms and excluding 0.6% unfavorable impact of the transfer of lower raw material costs. The period was marked by modest volume growth across North America, Europe, Middle East and Africa business regions, which was offset by lower volumes and unfavorable mix across Latin America and Specialty Cartons businesses. The rigid packaging segment reported an adjusted EBIT of $130 million, down 12.5% primarily due to a strong comparative period. The company reported lower earnings within the North America region on account of unfavorable mix in both beverage and specialty containers, which also led to higher costs. The Latin America region witnessed a 2% growth in volumes on pcp terms, however, earnings came lower as compared to the strong result experienced in the prior period. During the period, the company repurchased 21.9 million shares at a price consideration of $223 million.
.png)
Key Operational Highlights for H1FY20 (Source: Company Reports)
The Board of Directors announced unfranked dividend of US$0.1150 per ordinary share, payable on 24th March 2020.
Guidance:For FY20, the company expects adjusted EPS in constant currency terms within the range of 62.0 cents to 64.0 cents. Pre-tax synergy benefits are expected to come in at ~80 million while cash flow before dividends is anticipated to be at more than $1 billion.The company expects its cash flow after dividends within the range of $300 million to $400 million. Cash integration cost is expected at ~$100 million, while corporate expenses before synergies in constant currency terms are anticipated within the range of $160 million to $170 million. Net interest cost in constant currency terms is expected to come in at $210 million to $230 million. The company expects its adjusted effective tax rate within 21% to 23%.
Stock Recommendation:The stock of AMC is trading at $15.79 with a market capitalization of $25.83 billion. The stock is trading at the upper band of its 52-week trading range of $13.64 to $16.74. The company delivered a decent set of numbers in the first half and outlook for FY20. Adjusted EPS in 1HFY20 at 29.2 cents per share has improved by 10.7%. The company is progressing well to capture synergies with momentum building ahead of the initial expectations. Considering the first half results, current trading levels, and business prospects, we recommend a “Hold” rating on the stock at the closing price of $15.79, down 1.925% on 12th February 2020.
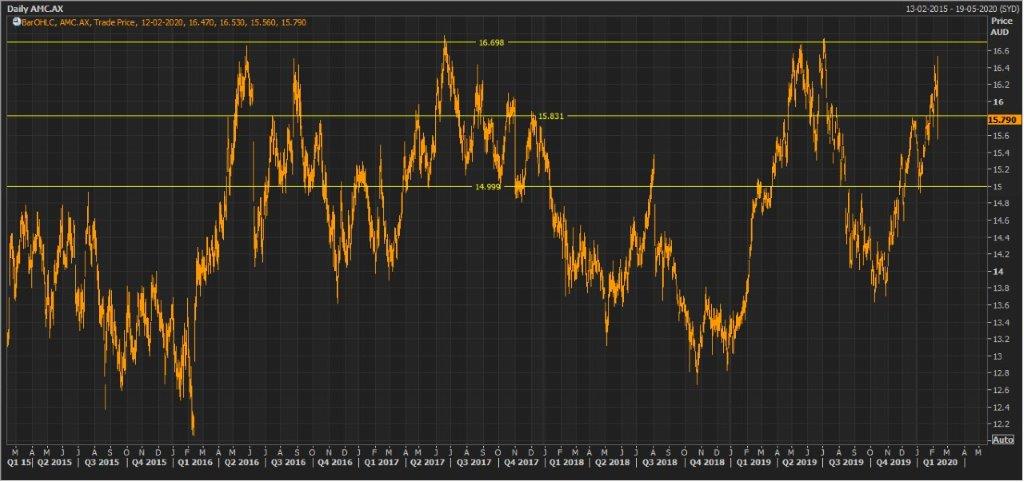
AMC Daily Technical Chart (Source: Thomson Reuters)
Orora Limited
ORA Details
A Decent Sales Growth at 13.3% in 1HFY20: Orora Limited (ASX: ORA) is a leading packaging solution company, which supplies a wide range of fibre, metal and glass packaging solutions, as well as packaging services including design and distribution.
H1FY20 Business Highlights for the Period ended 31 December 2019: ORA declared its full-year results, wherein the company reported sales revenue at $1,835.2 million, up 13.3% on y-o-y. EBIT stood at $133.1 million, representing a decline of 4.1% on pcp terms.Earnings during the period were impacted by a tough operating environment. Within the Australasia, underlying sales revenue increased by approximately 5.2%, driven by higher can volumes while Glass volumes were flat. EBIT from the segment came in at $82.6 million, up 1.8% on y-o-y basis, aided by higher revenues, which was partially offset by product mix in Glass and increased insurance and other input expenses. The business reported sales revenue from the North America at $1,423.0 million, up 16.9% on pcp. Earnings from the region were impacted due to lower local currency earnings in tough market conditions. During the period, the company invested more than $60.0 million to support organic capital projects and innovation.
.png)
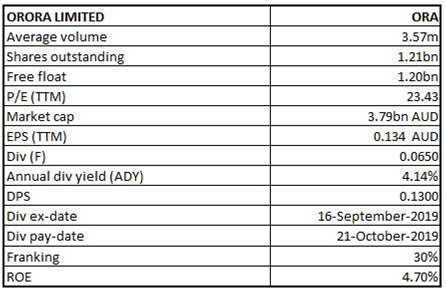
Key Financial Snapshot for H1FY20 (Source: Company Reports)
Outlook:As per the FY20 outlook, the company expects challenging market conditions to persist for the remainder of FY20. Due to the above factors coupled with the financial impact of the G2 rebuild in H2 and time for the North American improvement initiatives to be fully realised, the business expects lower FY20 operating EBIT as compared to FY19.
Valuation Methodology: Price to Earnings Based Valuation
.png)
Price to Earnings Value based Valuation(Source: Thomson Reuters)
Note: All forecasted figures and peers have been taken from Thomson Reuters, NTM-Next Twelve Mont
Stock Recommendation:The stock of ORA is trading at $3.010 with a market capitalization of $3.79 billion. The stock made a 52-week low and high of $2.600 and $3.460. The stock hasdelivered a negative return of 1.57% and 2.18%, in the last three months and six months, respectively. Within the Australasia region, the business remained consistent with its earnings growth. The earnings improvement was driven by a solid performance in Cans with volume growth in craft beer and a continued switch by consumers towards can formats. Considering the FY19 results, current trading levels, and business prospects, we have valued the stock using Price to Earnings based relative valuation method. For this, we have taken peers like Amcor PLC (ASX: AMC), Incitec Pivot Ltd (ASX: IPL), Orica Ltd (ASX: ORI), etc., and arrived at a target price of lower single-digit (in % terms). Hence, we recommend a “Hold” rating on the stock at the closing price of $3.010 per share, down 4.14% on 12th February 2020.
.jpg)
ORA Daily Technical Chart (Source: Thomson Reuters)
Disclaimer
The advice given by Kalkine Pty Ltd and provided on this website is general information only and it does not take into account your investment objectives, financial situation or needs. You should therefore consider whether the advice is appropriate to your investment objectives, financial situation and needs before acting upon it. You should seek advice from a financial adviser, stockbroker or other professional (including taxation and legal advice) as necessary before acting on any advice. Not all investments are appropriate for all people. Kalkine.com.au and associated pages are published by Kalkine Pty Ltd ABN 34 154 808 312 (Australian Financial Services License Number 425376). The information on this website has been prepared from a wide variety of sources, which Kalkine Pty Ltd, to the best of its knowledge and belief, considers accurate. You should make your own enquiries about any investments and we strongly suggest you seek advice before acting upon any recommendation. Kalkine Pty Ltd has made every effort to ensure the reliability of information contained in its newsletters and websites. All information represents our views at the date of publication and may change without notice. To the extent permitted by law, Kalkine Pty Ltd excludes all liability for any loss or damage arising from the use of this website and any information published (including any indirect or consequential loss, any data loss or data corruption). If the law prohibits this exclusion, Kalkine Pty Ltd hereby limits its liability, to the extent permitted by law to the resupply of services. There may be a product disclosure statement or other offer document for the securities and financial products we write about in Kalkine Reports. You should obtain a copy of the product disclosure statement or offer document before making any decision about whether to acquire the security or product. The link to our Terms & Conditions has been provided please go through them and also have a read of the Financial Services Guide. On the date of publishing this report (mentioned on the website), employees and/or associates of Kalkine Pty Ltd do not hold positions in any of the stocks covered on the website. These stocks can change any time and readers of the reports should not consider these stocks as advice or recommendations.
 AU
AU

 Please wait processing your request...