.png)
Stocks’ Details
BHP Group Limited
H1FY20 Underlying Attributable Profit Growth at 29%: BHP Group Limited (ASX: BHP) is primarily engaged in the development, exploration, production and processing of minerals. The market capitalisation of the company stood at A$77.56 Bn as on 13 March 2020. Recently, the company announced that Gary Goldberg, one of the directors, has acquired 2,000 ADSs (representing 4,000 ordinary shares) for a consideration of US$ 41.63 per ADS.
H1FY20 Financial Highlights for the Period ended 31 December 2019: During the period, the company reported underlying attributable profit of US$5.2 billion, which increased by 29% year over year. BHP’s total revenues for the period stood at US$22,294 Mn, an increase of 3% year over year. Underlying EBITDA for the period stood at US$12,084 million, depicting an increase 15% year over year. During the period, the company’s net operating cash flow amounted to US$7.4 billion, with free cash flow of US$3.7 billion, indicating higher iron ore prices and a solid operating performance. On the back of decent cash flow, the company declared an interim dividend amounting to 65 US cents per share, up 18% year over year.
.png)
1HFY20 Key Highlights (Source: Company Reports)
What to Expect: The company remains on track to advance its exploration programs in petroleum and copper, with the third phase of the drilling program at Oak Dam in South Australia in progress. This drilling program is projected to be completed in the June quarter this year.
Valuation Methodology: P/E Multiple Based Relative Valuation
.png)
P/E Based Valuation (Source: Thomson Reuters)
Note: All forecasted figures have been taken from Thomson Reuters, NTM: Next Twelve Months
Stock Recommendation: BHP is optimistic about the underlying fundamentals of its commodities even with near-term ambiguity. For FY20, the company is expecting total petroleum production in the ambit of 110 and 116 MMboe, and total copper production is likely to be in the band of 1,705kt and 1,820 kt. As per ASX, the stock is trading close to its 52-week low level of A$24.050. We have valued the stock using P/E based relative valuation method, and for the purpose, we have taken peers such as Rio Tinto Ltd (ASX: RIO), Fortescue Metals Group Ltd (ASX: FMG), South32 Ltd (ASX: S32), to name few. We have arrived at a target price with an upside of lower double-digit (in percentage terms). Hence, considering the decent cash flows, emphasis on petroleum exploration and record dividend paid to shareholders, we give a “Buy” recommendation on the stock at the current market price of A$26.72 per share, up by 1.481% on 13 March 2020.
Fortescue Metals Group Ltd
Enhancing Shareholder’s Value via Dividend Distribution a Key Catalyst: Fortescue Metals Group Ltd (ASX: FMG) is engaged in mining, processing, and transportation of iron ore. The market capitalisation of the company stood at A$27.06 Bn as on 13 March 2020. Recently, the company announced that Minderoo Group Pty Ltd, Forest Family Investments Pty Ltd and John Andrew Henry Forrest, substantial holders of the company, have increased their voting power from 35.22% to 36.25%. In another update, the company stated that John Andrew Henry Forrest, one of the directors in the company, has acquired 4,000,000 ordinary shares for a total consideration of $35,157,341.
H1FY20 Financial Highlights for the Period ended 31 December 2019: During the period, the company reported shipments of 88.6mt. Underlying EBITDA stood at US$4.2 billion, with an EBITDA margin of 65%. In the same time span, net profit after tax of the company came in at US$2.5 billion. The decent financial performance of the company enabled the board to pay a fully franked interim dividend of A$0.76 per share, representing a payout ratio of 65% of 1HFY20 NPAT. Net debt at the end of the period came in at US$0.7 billion, which incorporated US$3.3 billion cash on hand as at 31 December 2019.
.png)
1HFY20 Highlights (Source: Company Reports)
Outlook: For FY20, the company is anticipating shipments to be at the upper end of 170 – 175mt. FMG anticipates C1 costs to be in the range of US$12.75 – US$13.25/wmt on the back of strong performance in 1HFY20. Capital investment is expected to be US$2.4 billion.
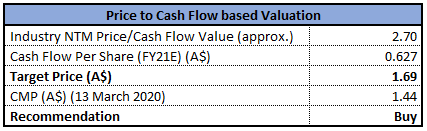
Valuation Methodology: P/CF Multiple based Valuation
.png)
P/CF Based Valuation (Source: Thomson Reuters)
Note: All forecasted figures have been taken from Thomson Reuters, NTM: Next Twelve Months
Stock Recommendation: The stock of the company is currently trading above the average of its 52-week high & low level of A$12.870 and A$5.899, respectively. Return on equity of the company stood at 21.2% in 1HFY20 as compared to the industry median of 4.7%. This reflects that the company has provided decent returns to shareholders against the broader industry. We have valued the stock using P/CF based-relative valuation method and arrived at a target price, which is offering an upside of higher single-digit (in percentage terms). For the purpose, we have taken peers such as Rio Tinto Ltd (ASX: RIO), BHP Group Ltd (ASX: BHP), OZ Minerals Ltd (ASX: OZL), to name few. Hence, considering the above factors, we maintain a “Hold” rating on the stock at the current market price of A$9.93 per share, up by 12.969% on 13 March 2020.
Northern Star Resources Ltd
Revenues Up 31% Year Over Year: Northern Star Resources Ltd (ASX: NST) is involved in the exploration & production of gold. The market capitalisation of the company stood at $8.93 Bn as on 13 March 2020. Recently, the company completed 3 years of exploration at the Acra Gold Joint Venture Project.
H1FY20 Financial Highlights for the Period ended 31 December 2019: During the period, the company reported a strong rise in revenue, earnings, cashflow and dividend. Revenues for the period came in at $826.98 million, up 31% year over year. NST witnessed an increase of 54% in net profit after tax. These results have been positively impacted due to decent gold sales of 398,640 ounces at an average price of $2,046/oz. Cash flow from operating activities stood at $297.5 million, up 76% year over year. The company declared an interim dividend of 7.5 cents per share, up 25% year over year.
.png)
1H FY20 Highlights (Source: Company Reports)
Outlook for FY20: For FY20, the company is expecting production in the range of 920koz – 1,040koz with AISC in the range of $1,240/oz – 1,340/oz. In addition, for 2HFY20, with respect to KCGM, the company is anticipating production in the range of 120koz and 140koz.
Valuation Methodology: P/E Multiple Based Relative Valuation
.png)
P/E Based Valuation (Source: Thomson Reuters)
Note: All forecasted figures have been taken from Thomson Reuters, NTM: Next Twelve Months
Stock Recommendation: The stock of the company is currently trading below the average of its 52-week trading high & low level of $15.280 to $7.85, respectively. The stock of thecompany generated positive returns of ~32.93% over a period of one year. Further, NST remains positive to reap benefits out of the KCGM acquisition in the near-term. Current ratio of the company stood at 5.2x in 1HFY20 as compared to the industry median of 1.7x. We have valued the stock using P/E based-relative valuation method and arrived at a target price, which is offering an upside of lower double-digit (in percentage terms). For the purpose, we have taken peers such as Newcrest Mining Ltd (ASX: NCM), Evolution Mining Ltd (ASX: EVN) and IGO Ltd (ASX: IGO). Therefore, considering the current trading level, deleveraged balance sheet, decent liquidity position and dividend to shareholders, we give a “Buy” recommendation on the stock at the current market price of $11.09 per share, down 8.119% on 13 March 2020.
Mineral Resources Limited
MIN Rides on Growth in Mining Services & Commodity Segment: Mineral Resources Limited (ASX: MIN) is involved in the integrated supply of goods and services to the resources sector. Recently, the company announced that it will distribute a dividend of $0.23per share, with a payment date of March 26, 2020.
H1FY20 Key Highlights for the period ended December 31, 2019: The company reported revenue for the period at $987 million, up 78% year over year. Underlying EBITDA for the period stood at $330 million, an increase of 224% on pcp, indicating robust growth in the Mining Services segment and record iron ore sales. Underlying NPAT for the period was reported at $129 million, up 279% year over year. Depreciation and amortisation for the period stood at $92 million, a rise of 102% on pcp, on the back of higher production in external Mining Services contracts, along with expanded production and elevated strip ratio at Koolyanobbing.
.png)
1H FY20 Highlights (Source: Company Reports)
Outlook for FY20: The company is targeting mining services EBITDA to be in the range of $280 - $300 million. As per the release, the company has emphasized that the impact of coronavirus on MIN’s business is difficult to be predicted currently.
Valuation Methodology: P/CF Multiple Based Relative Valuation
.png)
P/CF Based Valuation (Source: Thomson Reuters)
Note: All forecasted figures have been taken from Thomson Reuters, NTM: Next Twelve Months
Stock Recommendation: MIN’s stock is currently trading below the average of its 52-week high and low level of $19.680 and $12.440, respectively. Over a period of 6 months, the stock gave negative returns of ~4.70%. The stock of MIN is has a market capitalization of $2.56 billion, with a P/E multiple of 2.47x.Considering the company’s business operations, first-half FY20 performance, profitability margins, outlook and current trading levels, we have valued the stock using price to cash flow based relative valuation method and arrived at a target price of lower double-digit growth (in % terms). For the purpose, we have taken peers such as Western Areas Ltd (ASX: WSA), Pilbara Minerals Ltd (ASX: PLS), IGO Ltd (ASX: IGO) to name few. Hence, we give a “Buy” recommendation on the stock at the current market price of $14.62, up 7.5% on March 13, 2020.
Westgold Resources Limited
Underground Sub-level Cave Mining Resumes at Big Bell: Westgold Resources Limited (ASX: WGX) is engaged in the exploration, development and operation of gold mines, principally in Western Australia. On 4 March 2020, the company informed the market that underground sub-level cave mining has been resumed at the Cue Gold Operations (CGO) Big Bell. This is a major achievement for Westgold as the Big Bell underground mine was idle and flooded since 2003. The latest extractionmethod will enhance ground support and will lessen geotechnical risk.
H1FY20 Key Highlights for the period ended December 31, 2019: During the period, revenue from ordinary activities stood at $228.86 million, up 18% year over year. Net profit after tax from ordinary activities amounted to $9.74 million as compared to a loss of $11.23 million in the previous corresponding period. Gold production for the period stood at 120,127 oz, up 17% year over year. Cash inflow from operating activities for the period stood at $54.39 million, up 2279% on pcp.
.png)
1HFY20 Key Highlights (Source: Company Reports)
Valuation Methodology: P/CF Multiple Based Relative Valuation
P/CF Based Valuation (Source: Thomson Reuters)
Note: All forecasted figures have been taken from Thomson Reuters, NTM: Next Twelve Months
Stock Recommendation: WGX’ share posted a whopping one-year return of 44.35%, while in the span of six months, the stock posted a negative return of 30.83%. The stock is currently trading below the average of 52-week high and low of $2.570 and $1.045, respectively. Considering the company’s business operations, current trading level, H1FY20 performance, profitability margins, and recent update, we have valued the stock using P/CF based relative valuation method and arrived at a target price of lower double-digit growth (in % terms). Hence, we give a “Buy” recommendation on the stock at the current market price of $1.44, down ~13.253% as on March 13, 2020. The price drop was due to a rise in gold price attributed to global macro-economic worries especially concerning novel coronavirus (COVID-19), which has triggered heavy sell-off in the equity markets heading to shift in focus towards safe asset classes such as gold.
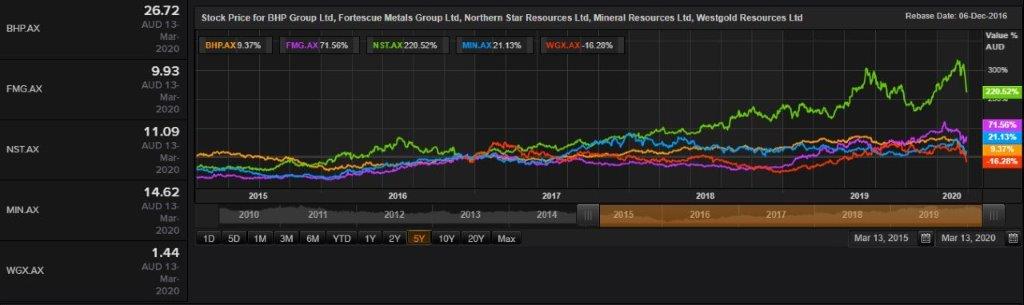
Comparative Price Chart (Source: Thomson Reuters)
Disclaimer
The advice given by Kalkine Pty Ltd and provided on this website is general information only and it does not take into account your investment objectives, financial situation or needs. You should therefore consider whether the advice is appropriate to your investment objectives, financial situation and needs before acting upon it. You should seek advice from a financial adviser, stockbroker or other professional (including taxation and legal advice) as necessary before acting on any advice. Not all investments are appropriate for all people. Kalkine.com.au and associated pages are published by Kalkine Pty Ltd ABN 34 154 808 312 (Australian Financial Services License Number 425376). The information on this website has been prepared from a wide variety of sources, which Kalkine Pty Ltd, to the best of its knowledge and belief, considers accurate. You should make your own enquiries about any investments and we strongly suggest you seek advice before acting upon any recommendation. Kalkine Pty Ltd has made every effort to ensure the reliability of information contained in its newsletters and websites. All information represents our views at the date of publication and may change without notice. To the extent permitted by law, Kalkine Pty Ltd excludes all liability for any loss or damage arising from the use of this website and any information published (including any indirect or consequential loss, any data loss or data corruption). If the law prohibits this exclusion, Kalkine Pty Ltd hereby limits its liability, to the extent permitted by law to the resupply of services. There may be a product disclosure statement or other offer document for the securities and financial products we write about in Kalkine Reports. You should obtain a copy of the product disclosure statement or offer document before making any decision about whether to acquire the security or product. The link to our Terms & Conditions has been provided please go through them and also have a read of the Financial Services Guide. On the date of publishing this report (mentioned on the website), employees and/or associates of Kalkine Pty Ltd do not hold positions in any of the stocks covered on the website. These stocks can change any time and readers of the reports should not consider these stocks as advice or recommendations.
 AU
AU
 Please wait processing your request...