.png)
Stocks’ Details
Spark Infrastructure Group
Strong Cash Flow Aided by Positive Contribution from all Segments: Spark Infrastructure Group (ASX: SKI) is a leading owner of a diversified portfolio of quality essential service infrastructure. On 4th March 2020, the company reported that Ms Karen Penros intended to resign from the Board, with effect from the conclusion of the AGM dated 27th May 2020.
FY19 Operational Highlights for the Period ended 31 December 2019: SKI reported operating cash flow of $379 million, up 15.7% on y-o-y basis. Victoria Power Networks segment reported a strong performance with regulated asset base growth of 3.8% on y-o-y basis to $6,339 million. The business derived revenue of $4,340 million from the SA Power Networks segment, depicting a growth of 2.2%. TransGrid segment reported its Regulated and Contracted Asset Base (RCAB) of $7,126 million, up 4.4% y-o-y, primarily due to augmentation projects. The business posted total electricity network assets of $18 billion at the end of FY19.
.png)
Key FY19 Operating Highlights (Source: Company Reports)
Dividend Distribution: The Board of Directors announced an unfranked dividend of $0.0750 per ordinary share with a payment date of 13 March 2020.
Guidance: The business expects the approval of PEC RIT-T in January 2020 while the submission of contingent project is expected in mid-2020. Commercial operations of Bomen Solar Farm are expected to commence in Q2FY20. Distribution is expected at a minimum of 13.5cps.
Valuation Methodology: Price to Earnings Based Relative Valuation
.png)
Price to Earnings Based Relative Valuation (Source: Thomson Reuters)
Note: All the forecasted figures are taken from Thomson Reuters, NTM: Next Twelve Months
Stock Recommendation:The stock of SKI closed at $2.070 with a market capitalization of ~$3.57 billion. The stock made a 52-week low and high of $2.00 and $2.555 and is currently trading at the lower band of its 52-week trading range. The stock has corrected by ~3.67% and ~7.49% in the last six months and one year, respectively. The business achieved an average payout ratio of 71% of its net operating cash flows over the last four years and is expected to continue the trend in coming years. Considering the aforesaid facts, current trading levels and business prospects, we have valued the stock using Price to Earnings based relative valuation method. For the purpose, we have considered peers like AusNet Services Ltd (ASX: AST), APA Group (ASX: APA), AGL Energy Ltd (ASX: AGL), etc., and arrived at a target price with a lower double-digit upside (in % terms). Hence, we give a ‘Buy’ recommendation on the stock at the closing price of $2.07, down 1.429% as on 6th March 2020.
Infigen Energy
Strong Business Performance Aids Double Digit Bottom-line Growth: Infigen Energy (ASX: IFN) operates in the energy generation segment and is a developer, owner and operator of energy generation assets.
FY19 Operational Highlights for the Period ended 31 December 2019: IFN declared its full year results, wherein the company reported net revenue of $134.3 million, up 13% on y-o-y basis, aided by increase in Renewable Energy Generation and added contributions from Smithfield OCGT and SA Battery. EBITDA on an underlying basis came in at $98.2 million, up 11% on y-o-y basis, due to a positive impact of $2.1 million from the adoption of ‘AASB16 Leases’. NPAT stood at $26.2 million, depicting a growth of 24% on y-o-y basis, reflecting a strong business performance overall. Renewable Energy Generation sales stood at reported at 1,071 GWh, up 17% on y-o-y basis.
.png)
FY19 Income Statement Highlights (Source: Company Reports)
Outlook: For FY20, the company expects generation of renewal energy to remain higher than FY19, while P50 renewable energy generation is expected to be ~1.9TWh. The company expects business operating costs to be slightly higher than FY19 at ~$25 million.
Valuation Methodology: Price to Earnings Based Relative Valuation
.png)
Price to Earnings Based Relative Valuation (Source: Thomson Reuters)
Note: All the forecasted figures are taken from Thomson Reuters, NTM: Next Twelve Months
Stock Recommendation:The stock of IFN is trading at $0.625 with a market capitalization of ~$615.78 million. The stock made a 52-week low and high of $0.427 and $0.810. The stock has generated mixed returns of ~1.59% and ~- 3.03% in the last three months and six-months, respectively.The business is focusing on customer acquisition and has diversified its customer base within the commercial & industrial (C&I) channel. Considering the aforesaid facts, current trading levels and business prospects, we have valued the stock using Price to Earnings based relative valuation method. For this purpose, we have considered peers like AGL Energy Ltd (ASX: AGL), Spark Infrastructure Group (ASX: SKI), AusNet Services Ltd (ASX: AST), etc., and arrived at a target price which is offering a limited downside (in % terms). Hence, we have a watch stance on the stock at the closing price of $0.625, down 2.344% as on 6th March 2020.
Ausnet Services Limited
Increase in Expenses Resulted in Lower EBITDA: Ausnet Services Limited (ASX: AST) operates in the electricity transmission and gas distribution businesses. Recently, the company reported a successful pricing of a 10.5-year bond worth EUR500 million with a coupon rate of 0.625%. The company will utilize its funds to refinance existing debt and funding of capital expenditure.
H1FY20 Operational Highlights for the Period ended 30 September 2019: AST declared its half yearly results, wherein revenue stood at $1,020.7 million, down 2.5% on y-o-y basis. EBITDA stood at $625.8 million, down 0.9% on pcp terms. The decrease was predominantly due to higher vegetation management costs and higher transmission use of system (TUOS) costs. Cash flow from operations was impacted by higher income tax paid due to higher immediately deductible capital expenditure in the previous period. The company reported $17.3 million reduction in Mondo due to changes to some low margin field services contracts and a change in lease accounting standard. During the period, depreciation increased by $6.4 million, due to the new lease accounting standard, as extra depreciation arose from right-of-use lessee assets.
.png)
H1FY20 Income Statement Highlights (Source: Company reports)
Guidance: For FY20, the company expects to pay a total dividend of 10.2 cps, up 5% on FY19, with a franking rate of 40% to 50%. The company also expects continued growth in its regulated asset base by ~3% per annum to FY22. The business expects to achieve a target of $1.5 billion contracted energy infrastructure assets by FY24.
Valuation Methodology: Price to Earnings Based Relative Valuation
.png)
Price to Earnings Based Relative Valuation (Source: Thomson Reuters)
Note: All the forecasted figures are taken from Thomson Reuters, NTM: Next Twelve Months
Stock Recommendation:The stock of AST is trading at $1.705 with a market capitalization of ~$6.41 billion. The stock made a 52-week low and high of $1.620 and $1.995. The stock has generated mixed returns of ~2.99% and ~- 3.37% in the last three months and six-months, respectively.Going forward, the company is expected to deliver positive outcomes to its customers aided by efficient utilization of its resources and investing across growth opportunities. Considering the aforesaid facts, current trading levels and business prospects, we have valued the stock using Price to Earnings based relative valuation method and arrived at a target price with a minor correction (in % terms). Hence, we have a wait and watch stance on the stock at the closing price of $1.705, down 0.872 % as on 6th March 2020.
Genesis Energy Limited
NPAT Declined by 81.4% on y-o-y Basis: Genesis Energy Limited (ASX: GNE) is engaged in the business of electricity generation and electricity retailing.
H1FY20 Operational Highlights for the period ended 31st December 2019: GNE declared its half yearly results, wherein the company posted revenue of NZ$1,334.2 million, down 2% on pcp. EBITDAF was reported at NZ$167.2 million, down 15.3% on y-o-y basis due to reduced gas availability, higher thermal fuel costs, reduced hydro generation and a planned Kupe outage. Wholesale segment reported total generation of 3,454 GWh at an average price of NZ$117/MWh. Within the retail segment, the business reported growth in netbacks of Electricity at 4.1%, Gas at 10.3% and LPG at 17.9%. Cost to serve customers has fallen by 3.5% on pcp terms. Within the Kupe segment, the business reported lower gas field production, down 14% on y-o-y basis to 4.9 PJ, on account of a planned statutory 30-day outage during November. Net profit decreased to NZ$9.2 million, as compared to NZ$49.4 million in H1FY19.
.png)
FY19 Income Statement Highlights (Source: Company Reports)
Outlook: For FY20, the business expects improvement in its performance primarily during the second half of FY20. FY20 EBITDAF is expected within the range of NZ$360 million to NZ$370 million, subject to hydrological conditions, gas availability or any material events. The company expects capital expenditure of ~NZ$100 million for FY20.
Valuation Methodology: Price to Earnings Based Relative Valuation
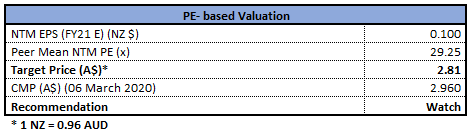
Price to Earnings Based Relative Valuation (Source: Thomson Reuters)
Note: All the forecasted figures are taken from Thomson Reuters, NTM: Next Twelve Months
Stock Recommendation:The stock of GNE closed at $2.96 with a market capitalization of ~$3.02 billion. The stock made a 52-week low and high of $2.71 and $3.47. The stock has generated negative returns of ~2.01% and ~14.33% in the last three months and six-months, respectively.Total LPG Sales Volume rose by 21.1% highlighting the success of the company’s unique vertical market position. Considering the aforesaid facts, current trading levels and business prospects, we have valued the stock using Price to Earnings based relative valuation method. For this purpose, we have considered peers like AGL Energy Ltd (ASX: AGL), Spark Infrastructure Group (ASX: SKI) and AusNet Services Ltd (ASX: AST), and arrived at a price correction of single digit (in % terms). Hence, we have a wait and watch stance on the stock at the closing price of $2.96, up 1.024 % as on 6th March 2020.
.jpg)
Comparative Price Chart (Source: Thomson Reuters)
Disclaimer
The advice given by Kalkine Pty Ltd and provided on this website is general information only and it does not take into account your investment objectives, financial situation or needs. You should therefore consider whether the advice is appropriate to your investment objectives, financial situation and needs before acting upon it. You should seek advice from a financial adviser, stockbroker or other professional (including taxation and legal advice) as necessary before acting on any advice. Not all investments are appropriate for all people. Kalkine.com.au and associated pages are published by Kalkine Pty Ltd ABN 34 154 808 312 (Australian Financial Services License Number 425376). The information on this website has been prepared from a wide variety of sources, which Kalkine Pty Ltd, to the best of its knowledge and belief, considers accurate. You should make your own enquiries about any investments and we strongly suggest you seek advice before acting upon any recommendation. Kalkine Pty Ltd has made every effort to ensure the reliability of information contained in its newsletters and websites. All information represents our views at the date of publication and may change without notice. To the extent permitted by law, Kalkine Pty Ltd excludes all liability for any loss or damage arising from the use of this website and any information published (including any indirect or consequential loss, any data loss or data corruption). If the law prohibits this exclusion, Kalkine Pty Ltd hereby limits its liability, to the extent permitted by law to the resupply of services. There may be a product disclosure statement or other offer document for the securities and financial products we write about in Kalkine Reports. You should obtain a copy of the product disclosure statement or offer document before making any decision about whether to acquire the security or product. The link to our Terms & Conditions has been provided please go through them and also have a read of the Financial Services Guide. On the date of publishing this report (mentioned on the website), employees and/or associates of Kalkine Pty Ltd do not hold positions in any of the stocks covered on the website. These stocks can change any time and readers of the reports should not consider these stocks as advice or recommendations.
 AU
AU

 Please wait processing your request...