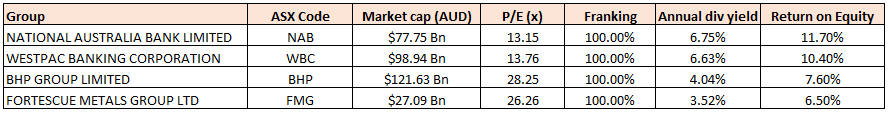
Stocks’ Details
National Australia Bank Ltd
Cost Saving Program on Track: National Australia Bank Ltd (ASX: NAB) offers services related to banking, credit card, leasing, housing and general finance. The bank simultaneously is engaged in the international banking, investment banking, wealth management, funds management and custodian, trustee and nominee services.
The bank recently announced ordinary fully franked dividend of AUD 1.07290 on NABPD - CAP NOTE 3-BBSW+4.95% PERP NON-CUM RED T-07-22. Ex and payment for the same are set at September 27, 2019 and October 8, 2019, respectively. The bank also informed the market about its Director, David Hugh ARMSTRONG’s interest in the bank who purchased 375 ordinary shares for the consideration of $9,724. With this, the total shares held by the director is 12,074 Ordinary shares and 900 Convertible Preference Shares II (NABPB). The bank will announce its FY19 third quarter trading update on 14 August 2019.
Key Highlights of 1H FY19 Performance: NIMs saw a downtick of 7 bps, mainly driven by housing lending competition and changes seen in product mix. Expenses growth at 1.7% reflected the ongoing investment which was partially offset by productivity benefits. Credit impairment charges witnessed a sharp rise of 20.4% to $449 million and posted a 2bps uptick as a percentage of gross loans and acceptances to 15 bps. Group CET1 (Common Equity Tier 1) ratio at 10.4% was up 20 bps on a sequential basis. Quarterly average of liquidity coverage ratio stood at 130% with NSFR (net stable funding ratio) at 112%.
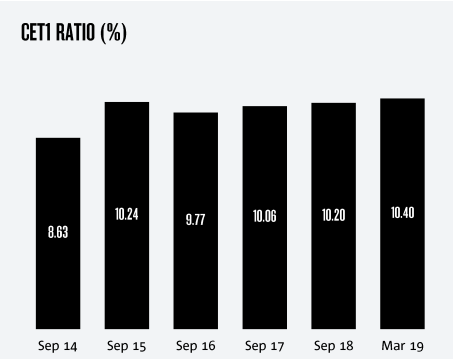
CET Ratio (Source: Company Reports)
Outlook and Stock Recommendation: Expenses growth was slower during 1H19 and posted a decline of 2% as compared to 2H FY 2018. Going forward, the bank expects a broadly flat expense growth for FY19 and FY20 excluding large notable expenses.NAB’s three years transformation program is on track and the bank has achieved a total cost saving of $512 million since September 2017. The bank continues to target cumulative cost savings of at least $1 billion by 30 September 2020.
At the current market price of $26.750, annual dividend yield for the stock stands at 6.75%. Looking at the price performance, the stock has gained ~14% on YTD basis. The performance of 1H19 was sufficed on the face of economic challenges prevailed in the industry. With the cost saving program on track, well capitalized position, reorientation culture towards customers, expected better lending growth, we recommend to “Buy” the stock at the current market price of $26.750 (down 0.816% on 08 July 2019).
Westpac Banking Corporation
Well Capitalized with CET1 at 10.64%:Westpac Banking Corporation (ASX: WBC) is engaged in the provision of financial services including lending, accepting deposit, payments services, etc. The Bank also offers services such as investment portfolio management, superannuation and funds management, insurance, leasing finance, general finance, etc. The bank recently announced an ordinary dividend of AUD 1.07800 on WBCPG - CAP NOTE 3-BBSW+4.90% PERP NON-CUM RED T-12-21 with ex and payment date at September 19, 2019 and September 30, 2019, respectively.
1H19 results reflected the weaker business conditions with cash earnings down 22% (down 5% excluding remediation, restructuring, etc. costs). Bank’s performance for the period was largely impacted by remediation costs and restructuring items.
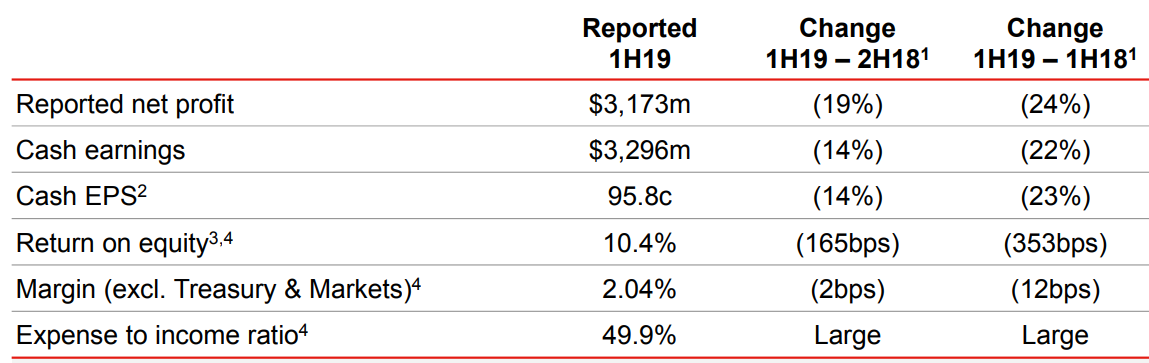
H119 Earnings Snapshot (Source: Company Reports)
Common equity Tier 1 (CET1) capital ratio for the bank stood at 10.64% at 31 March 2019, up 1 bps as compared to 30 September 2018.Leverage ratio at 31 March 2019, came in at 5.72%, down 12 bps on a sequential basis. Liquidity Coverage Ratio (LCR) which requires banks to hold sufficient high-quality liquid assets, as at 31 March 2019 stood at 138% as compared to 133% at 30 September 2018 and the average LCR for the quarter ending 31 March 2019 at 134%.
Going forward, the bank is proactively addressing legacy issues with improved products and services. The size and strength of growing customer franchise, strong balance sheet, disciplined cost management, etc., augur well for the business prospects and growth. At the current market price of $28.020, the stock is available at the price to earnings multiple of 13.760x. Annual dividend yield for the stock stands at 6.63%. Given the aforesaid facts and current trading levels, we recommend a “Hold” rating on the stock at the current market price of $28.020 (down 1.164% on 08 July 2019).
BHP Group Limited
Trading Updates For The Nine Months Ended 31 March 2019: BHP Group Limited (ASX: BHP)is among the world’s top producers of major commodities, including iron ore, metallurgical coal and copper. The company also have substantial interests in oil & gas and energy coal.
In March YTD 2019, production growth of Petroleum, Iron ore, Metallurgical coal and Energy coal were broadly in line with the prior corresponding period.Whereas copper posted a de-growth of 3% in March YTD 2019 as compared to March YTD 2018. The company recently updated about the changed interest of Director - Ian Cockerill who acquired 3,500 ordinary shares in BHP Group Plc for the consideration of GBP 19.25 per share.
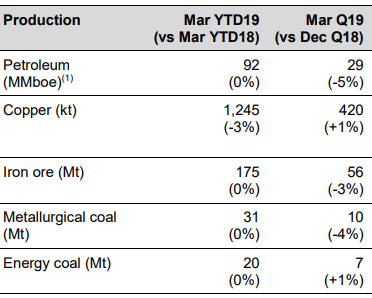
Snapshot of the Performance (Source: Company Reports)
What To Expect: Production guidance for FY19 is unchanged for petroleum, copper, metallurgical coal and energy coal. FY19 guidance for Iron ore production has been reduced to in the range of 265 and 270 Mt. FY19 unit costs for Petroleum, Escondida and Queensland Coal are likely to be in the range of the given guidance. The management expects unit costs for Western Australia Iron Ore to be less than US$15 per tonne due to the impact of Tropical Cyclone Veronica. New South Wales Energy Coal’s unit costs are likely to be ~US$51 per tonne.
At the current market price of $40.560, the stock is trading at PE multiple of 28.250x with an annual dividend yield of 4.04%. Currently, the stock is slightly trading towards its 52-week high level of $42.330. Hence, in the view of aforesaid fact and current trading level, we recommend a “Hold” rating on the stock at the current market price of $40.560 (down 1.768% on 08 July 2019).
Fortescue Metals Group Limited
Total Shipment for 3Q19 at 38.3wmt: Fortescue Metals Group Limited (ASX: FMG) is engaged with the exploration, development, production, processing and sale of iron ore. The Management of FMG, recently advised about the official sod turning of the Eliwana Mine and Rail Project valued at US$1.275 billion in the Pilbara, Western Australia. The project includes the construction of 143 km of rail, a new 30mtpa dry OPF (ore processing facility) and infrastructure. The Management expects first ore on train in the month of December 2020.
As per the March 2019 Quarterly Production Report, total shipments stood at 38.3mt including 3.8mt of West Pilbara Fines with C1 cost of US$13.51/wmt.The average strip ratio at 1.4 was in-line with the prior comparable quarter. The below table depicts sales by product which has been optimised to deliver higher margin:
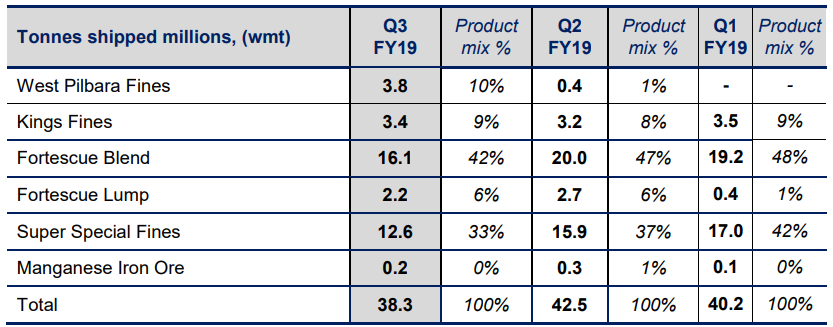
Tonnes Shipped millions, (wmt) (Source: Company Reports)
What to Expect: For FY19, the Management expects 165-170mt in shipments, inclusive of West Pilbara Fines product of 8-10mt. C1 costs are likely to be in the range of US$13-13.50/wmt with average strip ratio at 1.5. Total capex is expected at US$1.2 billion for FY19, including FMG’s share of the Iron Bridge Magnetite Project. Depreciation and amortisation are estimated at US$7.10/wmt for FY19.
Stock Recommendation: At the current market price of $8.850, the stock is trading at price to earnings multiple of 22.260x. Annual dividend yield currently stands at 3.52%. FMG has been consistently delivering on various parameters with low cost status. With the exuberant prospects of the business, extended assets along with FY19 guidance and valuations, we recommend a “Hold” rating to the stock at the current market price of $8.850 (up 0.568% on 08 July 2019).

Comparative Price Chart (Source: Thomson Reuters)
Disclaimer
The advice given by Kalkine Pty Ltd and provided on this website is general information only and it does not take into account your investment objectives, financial situation or needs. You should therefore consider whether the advice is appropriate to your investment objectives, financial situation and needs before acting upon it. You should seek advice from a financial adviser, stockbroker or other professional (including taxation and legal advice) as necessary before acting on any advice. Not all investments are appropriate for all people. Kalkine.com.au and associated pages are published by Kalkine Pty Ltd ABN 34 154 808 312 (Australian Financial Services License Number 425376). The information on this website has been prepared from a wide variety of sources, which Kalkine Pty Ltd, to the best of its knowledge and belief, considers accurate. You should make your own enquiries about any investments and we strongly suggest you seek advice before acting upon any recommendation. Kalkine Pty Ltd has made every effort to ensure the reliability of information contained in its newsletters and websites. All information represents our views at the date of publication and may change without notice. To the extent permitted by law, Kalkine Pty Ltd excludes all liability for any loss or damage arising from the use of this website and any information published (including any indirect or consequential loss, any data loss or data corruption). If the law prohibits this exclusion, Kalkine Pty Ltd hereby limits its liability, to the extent permitted by law to the resupply of services. There may be a product disclosure statement or other offer document for the securities and financial products we write about in Kalkine Reports. You should obtain a copy of the product disclosure statement or offer document before making any decision about whether to acquire the security or product. The link to our Terms & Conditions has been provided please go through them and also have a read of the Financial Services Guide. On the date of publishing this report (mentioned on the website), employees and/or associates of Kalkine Pty Ltd do not hold positions in any of the stocks covered on the website. These stocks can change any time and readers of the reports should not consider these stocks as advice or recommendations.
 AU
AU

 Please wait processing your request...