WAM Research
.png)
WAX Details
Robust Investment Return Since Inception: WAM Research Limited (ASX: WAX) is a small-cap company with the market capitalization of circa $320.29 Mn as of September 04, 2018. The company has delivered a robust performance return of 17.5% p.a. since inception. In the month of July 31, 2018, the group underperformed the S&P/ASX All Ordinaries Accumulation Index by -0.2% as the Global equity market was somewhat weaker because of trade-war fears. As of now, the portfolio is being affected by several issues such as geopolitical tension over trade war, foreign exchange volatility. However, these negative issues will not have a significant impact on the ability of the fund’s share portfolio to pay dividends to its shareholders. Moreover, the portfolio favors franked dividend policy and high yield stocks’ strategy which supports high exposure in the Australia market. On the positive side, Australian growth remains strong and the interest rate is expected to remain low till next year.
.png)
Investment Performance and Index Return (Source: Company Reports)
Based on macroeconomic scenario, the fundamentals look solid and provide capital growth opportunity over the medium-to-long term. For FY18, the group reported 42.2% growth in operating profit before tax and its investment portfolio also outperformed the index. Meanwhile, the stock has risen 11.84 percent in the past three months as at September 03, 2018 and trading close to 52-week high level of $1.700. Based on foregoing, we maintain our “Hold” recommendation on the stock at the current market price of $ 1.695.
.png)
WAX Daily Chart (Source: Thomson Reuters)
WCM Global Growth
.png)
WQG Details
Update on Buy-Back Event: WCM Global Growth Limited (ASX: WQG) updated the market about the progress on several transactions under its ongoing buy-back event. The group indicated to buy back a maximum number of 8,107,008 shares through on-market purchase. As of now, the group has bought back a total of 9,85,633 shares via on-market trade for the total consideration of A$ 10,73,617.35. Besides this, the company posted full-year Revenues from ordinary activities at $17.788 Mn and Net profit for the period attributable to members of $10.908 Mn. As at 30 June 2018, the Company’s after-tax Net Tangible Asset value per share increased to $1.167 from $1.051 at 30 June 2017. The NTA return recorded 11.0% as compared to a pre-tax return of 15.6% for the MSCI ACWI (ex-Australia) benchmark. There have been no dividends declared or paid for the period ended 30 June 2018.
.png)
Financial Highlights (Source: Company Reports)
Meanwhile, the share price climbed up 3.35% in the past three months as on September 03, 2018. By looking at the current trading level and its decent financial performance in FY18, we give a “Speculative Buy” recommendation on the stock at the current market price of $1.080.
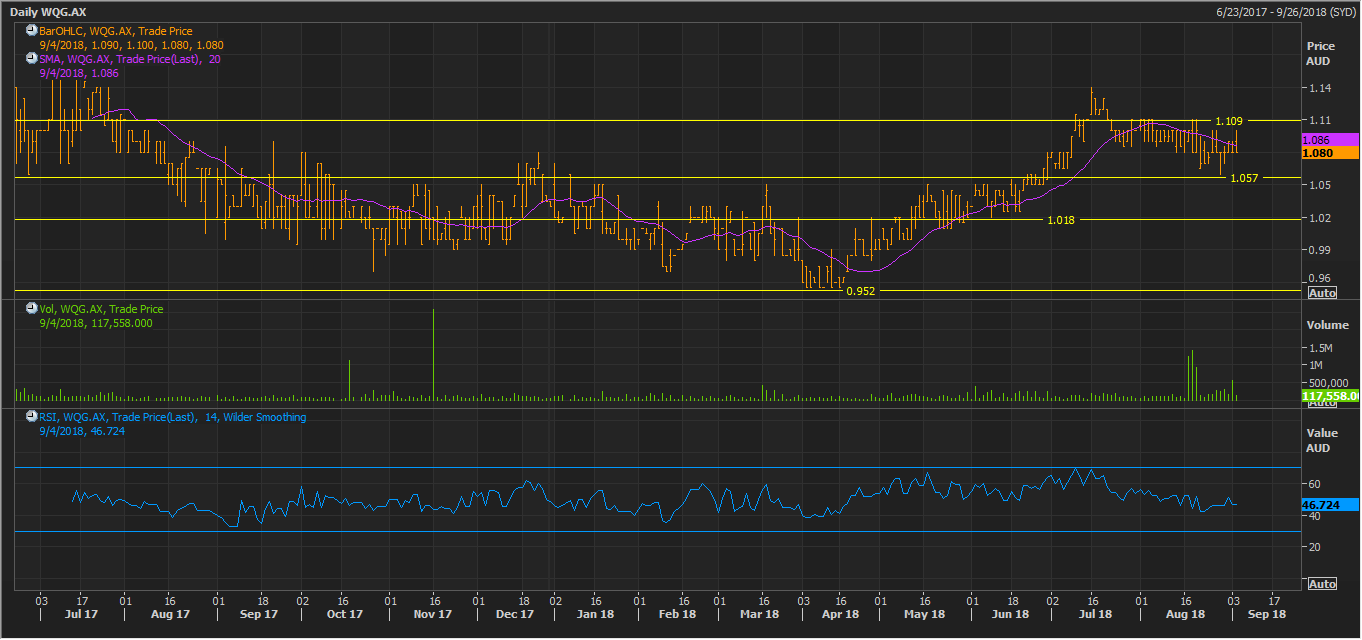
WQG Daily Chart (Source: Thomson Reuters)
Milton Corporation
.png)
MLT Details
Decent Portfolio Performance as at July 31, 2018:Milton Corporation Limited (ASX: MLT) is an investment company and has long-term track record of paying fully franked dividends which are predominantly funded by the dividends received from its equity investments portfolio. Recently, the Group posted Net Tangible Assets (NTA) per share before tax of $4.83 as on July 31, 2018 while NTA per share after tax amounted to $4.22. Besides this, TPR (Total Portfolio Return), an indicator of LIC performance of MLT stood at 9.03% and it was close to the Accumulated Return of the All Ordinaries Index return (XAOAI) of 9.42% over 15 years. The group has a decent asset classification wherein Bank, other financial sector, Materials, and Consumer Staplesgroups hold 29.3%, 12.3%, 10.1%, and 10.0%, respectively as on July 31, 2018.
.png)
Decent Portfolio Performance Aligning with the XAOAI (Source: Company Reports)
Milton has always invested in well managed companies that have a profitable history and are expected to grow dividends over time. Besides this, the Unlisted Investment Company acquisition has been completed and 5,575,148 ordinary shares were issued on 17 August 2018 to the vendors as consideration. As at 26 July 2018, the acquired company had a portfolio of long term investments in Australian listed companies valued at $23 Mn, cash of $3.7 Mn with no debt. As of now, we continue to maintain our “Hold” recommendation on the stock at the current market price of $ 4.610.
.png)
MLT Daily Chart (Source: Thomson Reuters)
Glennon Small Companies
.png)
GC1 Details
Decent Outlook:Glennon Small Companies Limited (ASX: GC1) is a small-cap company with the market capitalization of circa $51.4 Mn as of September 04, 2018. The group delivered strong performance in FY18 wherein revenue from ordinary activities increased by 667% to $13.61 Mn over the prior year. Profit from ordinary activities after tax attributable to members marked a splendid growth of 2,834% and amounted to 9.44 Mn in FY18 as compared to the previous year. As at 30 June 2018, the Company’s Net tangible asset backing per share increased to $1.1374 from $0.9801 at 30 June 2017. Based on the performance, the Board of Directors has declared a final dividend of 3 cents per share, franked at 30% which is in line with the 2017 final dividend payment. It will be paid on 18 September 2018 with the record date of 29 August 2018.
.png)
FY18 Financial Highlights (Source: Company Reports)
Meanwhile, GC1 stock has risen 11.34 per cent in the past three months as at September 03, 2018 and traded close to the 52-week high level of $1.170. Hence, we give a “Hold” recommendation on the stock at the current market price of $ 1.070 as the portfolio is well positioned and we still assume that the companies in the portfolio offer considerable upside momentum.
.png)
GC1 Daily Chart (Source: Thomson Reuters)
Disclaimer
The advice given by Kalkine Pty Ltd and provided on this website is general information only and it does not take into account your investment objectives, financial situation or needs. You should therefore consider whether the advice is appropriate to your investment objectives, financial situation and needs before acting upon it. You should seek advice from a financial adviser, stockbroker or other professional (including taxation and legal advice) as necessary before acting on any advice. Not all investments are appropriate for all people. Kalkine.com.au and associated pages are published by Kalkine Pty Ltd ABN 34 154 808 312 (Australian Financial Services License Number 425376). The information on this website has been prepared from a wide variety of sources, which Kalkine Pty Ltd, to the best of its knowledge and belief, considers accurate. You should make your own enquiries about any investments and we strongly suggest you seek advice before acting upon any recommendation. Kalkine Pty Ltd has made every effort to ensure the reliability of information contained in its newsletters and websites. All information represents our views at the date of publication and may change without notice. To the extent permitted by law, Kalkine Pty Ltd excludes all liability for any loss or damage arising from the use of this website and any information published (including any indirect or consequential loss, any data loss or data corruption). If the law prohibits this exclusion, Kalkine Pty Ltd hereby limits its liability, to the extent permitted by law to the resupply of services. There may be a product disclosure statement or other offer document for the securities and financial products we write about in Kalkine Reports. You should obtain a copy of the product disclosure statement or offer document before making any decision about whether to acquire the security or product. The link to our Terms & Conditions has been provided please go through them and also have a read of the Financial Services Guide. On the date of publishing this report (mentioned on the website), employees and/or associates of Kalkine Pty Ltd do not hold positions in any of the stocks covered on the website. These stocks can change any time and readers of the reports should not consider these stocks as advice or recommendations.
 AU
AU

 Please wait processing your request...