.png)
Stocks’ Details
NextEra Energy, Inc.
COVID-19 Update: NextEra Energy, Inc.(NYSE: NEE) is a public utility holding company, which is involved in the generation, transmission, distribution, and sale of electric energy. Recently, the company stated that it has donated more than $4 million in COVID-19 emergency assistance, which depicts the company’s long-standing devotion for supporting the community during a crisis.
Q1FY20 Operating Highlights for the Period ended 31st March 2020: During the quarter, the company reported adjusted earnings of $2.38 per share, up from $2.20 per share in the prior-corresponding period. NEE’s operating revenues increased 13.2% year over year and came in at $4,613 million. Despite the ongoing challenges due to COVID-19 crisis, NEE’s capital projects continue to remain on track. Notably, FPL and Gulf Power have taken necessary measures to aid customers, as both the utilities have banned disconnection of electricity in Florida to make certain that customers have constant access to electricity irrespective of their financial conditions. NEE’s total operating expenses stood at $2,632 million, down 10.4% year over year. The company exited the period with a cash balance of $3,335 million, whereas long-term debt stood at $41.11 billion.
.png)
Key Highlights (Source: Company Reports)
Outlook: NEE continues to expect earnings to increase at a CAGR of 6-8% through 2021. NEE expects Florida acquisition synergies to improve earnings by 15 cents and 20 cents in FY20 and 2021, respectively. In FY22, the company expects earnings per share on adjusted basis in the ambit of $10-$10.75.
Stock Recommendation: The stock of NEE closed at $247.17 with a market capitalization of $120.9 billion. The stock made a 52-week low and high of $174.8 and $283.35 and is currently trading at the upper band of the range. At the closing price of $247.17, current yield for the stock stands at 2.38%.The stock has given a positive return of 29.83% in the last one year. The company is likely to benefit from higher residential demand as more and more Americans are staying at homes due to the ongoing COVID-19 crisis.On the valuation front, the stock is trading at an EV/Sales multiple of 8.5x as compared to the industry median of 4.3x on TTM (Trailing Twelve Months) basis. The stock is available at a PE multiple of 28.8x against the industry median of 17.4x on TTM basis, indicating an overvalued juncture at the current levels. Considering the latest results, valuations on TTM basis, and current trading levels, we have a watch stance on the stock at the closing price of $247.17, up 4.99% as on 22 April 2020.
Navios Maritime Acquisition Corporation
Revenues up 45.5% Year over Year: Navios Maritime Acquisition Corporation (NYSE: NNA) is engaged in providing marine transportation services and focuses on the transportation of petroleum products and bulk liquid chemicals.
4QFY19 Financial Highlights for the Period Ended 31 December 2019: NNA declared its 4QFY19 results, wherein the company reported total revenue of $85.4 million, up a whopping ~45.5% on y-o-y basis. During the quarter, the company acquired five product tankers, two Long Range one (“LR1”) product tankers and three Medium Range one (“MR1”) product tankers for a consideration of ~$84.4 million, post the liquidation of Navios Europe I. In 4QFY19, the company’s EBITDA stood at $45.9 million, a rise of 148.6% year over year. Adjusted earnings per share stood at 33 cents as compared to adjusted loss of $1.33 per share reported in the year-ago period. Net cash from operating activities came in at $8.2 million as compared to net cash used in operating activities of $14.9 million in 4QFY18.
.png)
Key Highlights (Source: Company Reports)
Balance Sheet Details: The company exited the period with cash and cash equivalents of $44 million and total assets amounting to $1.6 billion.The company has long-term debt of $1.2 billion as of 31st December 2019. The company declared a quarterly dividend of 30 cents per share paid on 7 April 2020.
Stock Recommendation: The stock of NNA closed at $6.09 with a market capitalization of ~$96.7 million. The stock made a 52-week low and high of $2.09 and $11.52, respectively, and is currently trading below the average of this range. At the closing price of $6.09, current yield for the stock stands at 20% The stock has corrected ~17.48% and 20.7% in the last three months and one year, respectively whereas it has run up 114.44% in the last one month. The company reported debt to equity ratio of 3.74x in FY19, much higher than the industry average of 0.74x. Moreover, the company has negative ROE of 18.9% in FY19. On the valuation front, the stock is trading at an EV/EBITDA multiple of 7.3x as compared to the industry average of 6.5x on TTM (Trailing Twelve Months) basis. Hence, we have a watch stance on the stock at the current market price of $6.09, up 1.5% on 22 April 2020.
Western Midstream Partners, LP
Sneak Peek at 1QFY20 Update: Western Midstream Partners, LP (NYSE: WES) formerly known as Western Equity Partners, LP was formed to own, operate, acquire, and develop midstream energy assets. On 20 April 2020, the company declared a quarterly cash distribution of $0.311 per unit for 1QFY20, a decline of 50% from the previous quarter’s per-unit distribution, payable on 14 May 2020. The lower cash distribution during the period was due to the company’s initiatives to protect and strengthen its balance sheet during the COVID-19 pandemic, decreasing economic activity and energy demand, along with reduced commodity prices.
The company also took the necessary steps to protect the health and wellbeing of the customers, employees, and their families. The company withdrew its previously announced outlook for FY20, except its capital expenditure, which it predicts to be in the range of $450-$550 million, indicating a 45% reduction to prior guidance. The company also expects to attain other cost reductions of ~$75 million through operating and maintenance and general and administrative expense cost-saving plans. WES is likely to report its full 1QFY20 results on 5 May 2020.
4QFY19 Financial Highlights for the Period Ended 31 December 2019: WES declared its 4QFY19 results, wherein the company reported total revenue and other income of $723.2 million, up from $692.6 million reported in the year-ago period. In 4QFY19, the company’s adjusted EBITDA stood at $447.6 million, down from $457.3 million reported in 4QFY18. Adjusted gross margin during the quarter came in at $644.3 million, up from $607.1 million reported in 4QFY18. Earnings per share stood at 62 cents as compared to 43 cents per share reported in the year-ago period.
.png)
Revenue Highlights (Source: Company Reports)
Balance Sheet & Cash Flow Details: The company exited the period with cash and cash equivalents of $99.9 million and total assets amounting to $12.3 billion.The company has a long-term debt of $7.9 billion as of 31st December 2019. Net cash from operating activities came in at $1.3 billion in FY19, almost flat on year over year basis.
Valuation Methodology: P/CF Multiple Based Relative Valuation
.png)
P/CF Based Valuation (Source: Thomson Reuters)
Note: All forecasted figures and peers have been taken from Thomson Reuters, NTM-Next Twelve Months
Stock Recommendation: The stock of WES closed at $6.22 with a market capitalization of ~$2.8 billion. The stock made a 52-week low and high of $2.9 and $34.36, respectively, and is currently trading close to its 52-week low level.At the closing price of $6.22, current yield for the stock stands at 41.47%. The stock has corrected ~68.02% and 81.74% in the last three months and one year, respectively. Considering the above factors, we have valued the stock using P/CF multiple based illustrative relative valuation method and arrived at a target price with an upside of lower double-digit (in % terms). For the purpose, we have taken peers like Plains All American Pipeline LP (NYSE: PAA), DCP Midstream LP (NYSE: DCP), and MPLX LP (NYSE: MPLX), to name few. Hence, we recommend a “Buy” rating on the stock at the current market price of $6.22, up 3.67% on 22 April 2020.
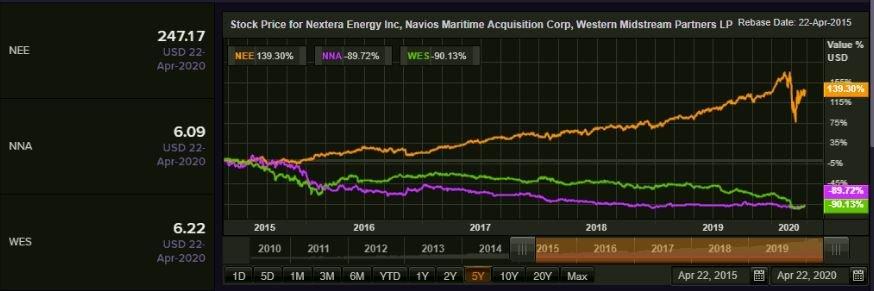
Comparative Price Chart (Source: Thomson Reuters)
Disclaimer
The advice given by Kalkine Pty Ltd and provided on this website is general information only and it does not take into account your investment objectives, financial situation or needs. You should therefore consider whether the advice is appropriate to your investment objectives, financial situation and needs before acting upon it. You should seek advice from a financial adviser, stockbroker or other professional (including taxation and legal advice) as necessary before acting on any advice. Not all investments are appropriate for all people. Kalkine.com.au and associated pages are published by Kalkine Pty Ltd ABN 34 154 808 312 (Australian Financial Services License Number 425376). The information on this website has been prepared from a wide variety of sources, which Kalkine Pty Ltd, to the best of its knowledge and belief, considers accurate. You should make your own enquiries about any investments and we strongly suggest you seek advice before acting upon any recommendation. Kalkine Pty Ltd has made every effort to ensure the reliability of information contained in its newsletters and websites. All information represents our views at the date of publication and may change without notice. To the extent permitted by law, Kalkine Pty Ltd excludes all liability for any loss or damage arising from the use of this website and any information published (including any indirect or consequential loss, any data loss or data corruption). If the law prohibits this exclusion, Kalkine Pty Ltd hereby limits its liability, to the extent permitted by law to the resupply of services. There may be a product disclosure statement or other offer document for the securities and financial products we write about in Kalkine Reports. You should obtain a copy of the product disclosure statement or offer document before making any decision about whether to acquire the security or product. The link to our Terms & Conditions has been provided please go through them and also have a read of the Financial Services Guide. On the date of publishing this report (mentioned on the website), employees and/or associates of Kalkine Pty Ltd do not hold positions in any of the stocks covered on the website. These stocks can change any time and readers of the reports should not consider these stocks as personalised advice.
 AU
AU

 Please wait processing your request...