
Stocks’ Details
Xero Limited
Strong Financial Indicators: Xero Limited (ASX: XRO) is a provider of online accounting software for small businesses. As on 6 April 2020, the market capitalization of the company stood at ~$931 billion. During 1H20, the company reported global growth with strong financial indicators and achieved a significant milestone of surpassing two million subscribers. During the half year, XRO executed on its strategy and reported an increase of 32% in operating revenue to $338.7 million and a YoY growth of $48.1 million in EBITDA. In the same time span, the company reported strong capital position with net cash balance of $101.4 million.
.png)
1H20 Financial Highlights (Source: Company Reports)
Future Expectations and Growth Opportunities: Xero Limited has an ongoing focus on growing its small business platform and to maintain a preference to reinvest the cash generated. The company expects free cash flow to be a similar proportion of total operating revenue to that reported in FY19.
Valuation Methodology: EV/Sales Multiple Based Relative Valuation
.png)
EV/Sales Multiple Based Approach (Source: Thomson Reuters), * 1NZD=0.98 AUD
Note: All the forecasted figures are taken from Thomson Reuters, NTM: Next Twelve Months,
Stock Recommendation: As per ASX, the stock of XRO gave a return of 8.73% in the past 6 months but a negative return of 17.86% in the last one month. During 1H20, gross margin of the company stood at 85.2%, slightly higher than the industry median of 84.1%. In the same time span, net margin of the company was 0.4% as compared to the industry median of 29.1%. Considering the volatility in returns, lower net margin and decent outlook, we have valued the stock using EV/Sales relative based valuation approach and have arrived at an indicative downside of lower double-digit (in percentage terms). For the said purposes, we have considered NEXTDC Ltd (ASX: NXT), Appen Ltd (ASX: APX) and WiseTech Global Ltd (ASX: WTC) as peers. Hence, we have a watch stance on the stock at the current market price of $69.39, up by 5.681% on 6 April 2020.
Technology One Limited
Record Net Profit: Technology One Limited (ASX: TNE) is engaged in the development, marketing, sales, implementation and support of fully integrated enterprise business software solutions. As on 6 April 2020, the market capitalization of the company stood at ~$2.54 billion. In the recently held presentation, the company reported strong results because of its transition to SaaS accounting with a growth of 16% in total ARR $202.5 million in FY19. The company has also reported a record net profit before tax of $76.4 million, positioning TNE for strong growth. In the same time span, TNE generated cashflow of $44.7 million. The decent financial performance of the company enabled the Board to declare a dividend of 11.93 cents per share, reflecting an increase of 8% on the pcp.
.png)
FY19 Full Year Summary (Source: Company Reports)
Outlook: The company expects continued strong growth in SaaS ARR and profit. The momentum of the company is similar and expects to continue to double its size in the next 4 to 5 years. It anticipates annual recurring revenues to increase to over $500 million in FY24 with a growth of approximately 35% in profit margins.
Valuation Methodology: EV/Sales Multiple Based Relative Valuation
.png)
EV/Sales Multiple Based Approach (Source: Thomson Reuters)
Note: All the forecasted figures are taken from Thomson Reuters, NTM: Next Twelve Months
Stock Recommendation: As per ASX, the stock of TNE gave a return of 12.1% in the past six months but a negative return of 5.57% in the last three months. The stock is also trading towards its 52-weeks high level of $9.40. During FY19, gross margin of the company stood at 86.3%, higher than the industry median of 71.8%. In the same time span, net margin of the company was 20.5% as compared to the industry median of 14.7%. Considering the volatility in returns, trading levels, modest outlook and higher margins, we have valued the stock using EV/Sales multiple relative based valuation and have arrived at an indicative downside of lower double-digit (in percentage terms). For the said purposes, we have considered Altium Ltd (ASX: ALU), WiseTech Global Ltd (ASX: WTC), etc., as peers. Hence, we have a watch stance on the stock at the current market price of $8.060, up by 1.129% on 6 April 2020.
Splitit Payments Ltd
Significant Increase in Sales Volume: Splitit Payments Ltd (ASX: SPT) provides credit card based instalment solution to businesses and merchants. As on 6 April 2020, the market capitalization of the company stood at $103.05 million. During FY19, the company witnessed strong business growth, enabling it to scale its business globally at a faster pace. During the year, the company reported an increase of 52% in merchant sales volumes to US$88 million and a significant growth of over 108% in revenue to US$1.65 million. During FY19, SPT had 119k active shoppers with total merchants of around 720.
.png)
FY19 Business Highlights (Source: Company Reports)
What to Expect: Splitit Payments Limited is well positioned to realize accelerating growth now the key foundational pillars are in place. The company will invest in increasingly efficient resources towards accelerating merchant acceptance and consumer usage. It expects increasing growth from customer experience, attracting influential brands in key industry and expanding small businesses online through technology and partnerships.
Stock Recommendation: As per ASX, the stock of SPT is trading close to its 52-weeks’ low level of $0.205, proffering a decent opportunity for accumulation. Despite the uncertain and deteriorating business environment triggered by the global COVID-19 health pandemic, the company remains confident for its growth due to its strong foundations. During FY19, the company has witnessed a substantial increase in gross margin over its previous year and stood at 70.8%, up from 49.3%. In the same time span, current ratio of the company was 11.96x, higher than the industry median of 2.21x. On the TTM basis, the stock is trading at a price to book value multiple of 3.1x, lower than the industry average (Software & IT Services) of 3.5x. Considering the trading levels, higher margins and decent outlook, we recommend a ‘Speculative Buy’ rating on the stock at the current market price of $0.340, up by 3.03% on 6 April 2020.
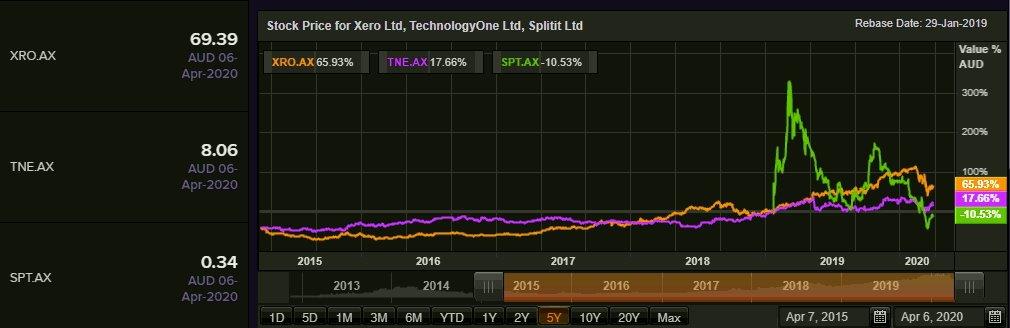
Comparative Price Chart (Source: Thomson Reuters)
Disclaimer
The advice given by Kalkine Pty Ltd and provided on this website is general information only and it does not take into account your investment objectives, financial situation or needs. You should therefore consider whether the advice is appropriate to your investment objectives, financial situation and needs before acting upon it. You should seek advice from a financial adviser, stockbroker or other professional (including taxation and legal advice) as necessary before acting on any advice. Not all investments are appropriate for all people. Kalkine.com.au and associated pages are published by Kalkine Pty Ltd ABN 34 154 808 312 (Australian Financial Services License Number 425376). The information on this website has been prepared from a wide variety of sources, which Kalkine Pty Ltd, to the best of its knowledge and belief, considers accurate. You should make your own enquiries about any investments and we strongly suggest you seek advice before acting upon any recommendation. Kalkine Pty Ltd has made every effort to ensure the reliability of information contained in its newsletters and websites. All information represents our views at the date of publication and may change without notice. To the extent permitted by law, Kalkine Pty Ltd excludes all liability for any loss or damage arising from the use of this website and any information published (including any indirect or consequential loss, any data loss or data corruption). If the law prohibits this exclusion, Kalkine Pty Ltd hereby limits its liability, to the extent permitted by law to the resupply of services. There may be a product disclosure statement or other offer document for the securities and financial products we write about in Kalkine Reports. You should obtain a copy of the product disclosure statement or offer document before making any decision about whether to acquire the security or product. The link to our Terms & Conditions has been provided please go through them and also have a read of the Financial Services Guide. On the date of publishing this report (mentioned on the website), employees and/or associates of Kalkine Pty Ltd do not hold positions in any of the stocks covered on the website. These stocks can change any time and readers of the reports should not consider these stocks as personalised advice.
 AU
AU

 Please wait processing your request...